
The following is a post I put up on June 12 "Market at Red Light in a Big Intersection":
The rally is at a critical turn point having just made it through the 100 dma a month or so ago and now struggling to break and hold the 200. This wouldn't be such a sticky wicket if the leader groups the broad market has been following were not at turn points themselves. These groups, like retail and consumer discretionary, have already successfully forged through the 200 dma and accomplished a 50/200 dma crossover (the S&P 500 has not), but now these generals are at this juncture: (click to enlarge charts)
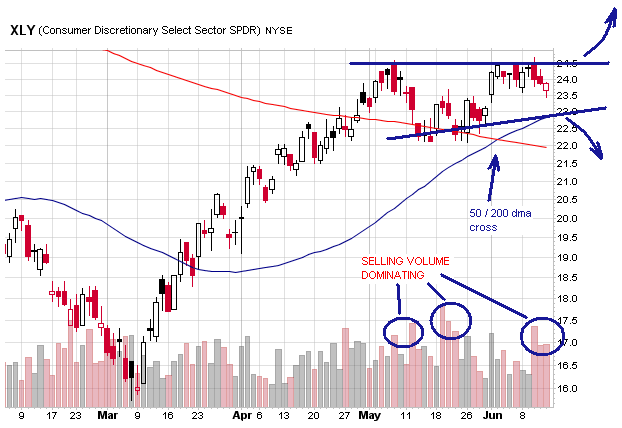
The RLX Retail Index is in pretty much the same condition. This triangle consolidation typically breaks sharply one way or the other. A break to the downside out of the formation is also a break of the 50 dma and would likely pull the S&P 500 back from its attempt to take up residence back above the 200 dma and force some more bear shenanigans. The volume pattern is perhaps more disturbing than the formation with a very clear bias to selling.
Over at safehaven.com/sh... Marty Chenard has an article and chart showing a RSI indicator that stalled at the top of each rally during the 2000-2003 market and was breached only when the 2003 bull began. Where are we now on the chart? Right at the same level as the rally tops in the previous bear. So we are at a turn point by this indicator as well.
Gold is also at a technical intersection:
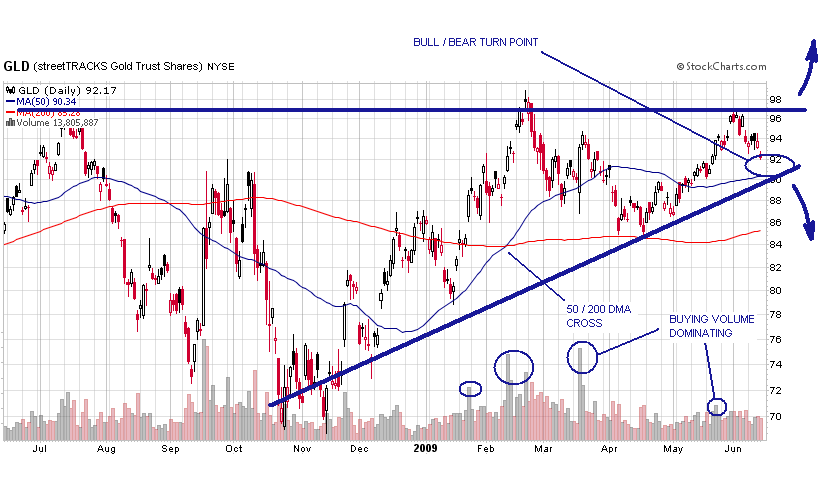
The GLD is approaching a bull/bear turn point at around 90. Like the XLY, a break of the formation to the downside is also a break of the 50 dma. If you go strictly by the big volume days indication, you would expect the stock market to turn down and gold to turn up, acting like they're supposed to (inversely correlated). But not so fast. There are many cases of both gold and the stock market making big moves together. You need to look no further than the last bear-to-bull transition of 2001-2004 to see an example of this.
I suspect that, after the big run from the low, the indexes are just doing a natural consolidation before continuing the bull move. But putting a lot of new money to work right now is a little dangerous. I raised some cash this week and will refrain from redeploying until I see how these turns play out.
Update: The formations on the RLX and XLY have since broken to the downside, the S&P has formed a head and shoulders top formation which has proceeded to break to the downside slipping back below the 140 EMA in the process. See the post "End Of Recession..." to see why we should be paying attention to the 140. Selling volume is dominating, accumulation/distribution is breaking down. In short, a lot of really bad stuff has happened. Add a siren to the red light.


Cramer said Friday the market was in (some weird word that meant "a funk") and not to worry. Good tech results will slap some sense back into Mr. Market.
ReplyDeleteRalph, I think Cramer has been saying we'll be in a ("weird German word" - he reminds me of Howard Cosell with his vocabulary show off) trading range with maybe Dow 7700 as the lower end, and we're likely headed there. Then Mr. Market comes to his senses. A strong rally often does a 40 to 50% retracement down before heading back up, which is Cramer's 7700 for the Dow (he must have gotten that from a technical analyst). If we get a good turn back up, I wouldn't expect too much of it until it clearly wins its next battle with the 140 EMA.
ReplyDelete