The "financial weapons of mass destruction " as Warren Buffett has been calling derivatives since 2002, are harmless and mostly beneficial most of the time - like bacteria. But when something upsets the natural, stable balance they thrive in, we can all get very, very sick. If you have ever bought a simple call option, you have dabbled in derivatives. Sometimes, these things work out and deliver an exciting homerun, but 80% or more of these contracts, which have deadlines, expire worthless. So "fun but dangerous" is the name of the game.
Having said that, derivatives have always been used like insurance policies with periodic premiums (worthless expirations) happily being paid by producers of all manner of crops and mined goods that have surprise price fluctuations. They purchase this insurance to hedge any unexpected price movement whilst they are busy getting their goods sold. So why does a smart guy like Buffett call them weapons of mass destruction?
I think a comment on an
article from
ABC "$710 Trillion: That's A Lot Of Exposure To Derivatives" explains the problem well:
...the problem is that too many people can take out derivatives beyond the real needs of the market. For example, imagine I can insure my $100,000 house against fire by paying a fee of $500. Imagine also that 199 other people take out the same fire insurance on MY property, perhaps even using borrowed money to do so. This is the current state of much derivatives activity. If the house burns down the insurance company is up for $20 million. They might well go broke since it is the same to them as having to pay out on 200 property fires. If they did go broke I might not even get my claim paid, yet the other claimants have no underlying real interest in the property or the fire. They have simply made a $500 bet with a $100,000 possible outcome and have done so on borrowed money. The liability should lie with me and my insurance company. So why should the government agree to bail out the 199?
It is simply way too many people playing with derivatives, not as sensible insurance, but for a fast buck. They are not producers. They are not owners. They are just players. I won't go into the massive scale of the problem, that is beyond the scope of this article. But if you are not aware, you should read up on this, in case you don't have enough things to worry about.
What I want to focus on here is banks. That is because the 4 or 5 mega US banks are exposed to about 90 - 95% of the total derivatives for the whole country. And this is typical globally. It is not mainly farmers hedging their crops or producers of anything buying insurance. It is financiers playing with OPM (Other Peoples' Money) in out-of-control complication, not protecting crops or insuring anything except their own investments. Thus a staggering 80% of all derivatives are gambles on interest rates. When you have the Fed announcing four rate increases this year, the rest of the world charging into negative rate territory, and the US economy in a manufacturing recession, it is a little worrisome that our banks are riverboat gambling over the next twitch in interest rates.
More than oil, China, recession, Greece, or any one thing, banking derivative abuse could be our number one problem. It is the one thing that ties all the other problems together and gives them an amplification device. And I would like to show how it may be what's driving gold right now.
The conventional wisdom for explaining what gold is doing is to look at what it's supposed to be dependent on. You know - it has to be doing the opposite of the USD, or be doing whatever commodities are doing, or opposite the broad stock market. Well, don't look now but it's not doing any of those things very well recently! Let's not try too hard to figure out what gold
should be doing and just look at the market's message on what gold
is doing.
Gold is breaking its historical correlation with the commodity complex. If you look at the CRB/gold pair, you see that in 2016, gold is sharply breaking away from commodities, and actually began doing this clear back in late 2014. Oil and gold are moving sharply in opposite directions. The gold miners, whose biggest cost is energy, may soon have a field day. (click on images to enlarge)
Gold began latching itself to something else in late 2014. Note the sharp, opposite move by gold
up as the stunning drop in commodities got a little crazy. Gold then resisted rejoining the CRB, building even more divergence until late 2015, where it is again bolting sharply in the opposite direction. Gold is not just another commodity anymore. So is gold just doing the opposite of the dollar now?
This is not a very good correlation either. Note that in the sharp, late 2014 commodities swoon, the dollar followed commodities, but gold clearly started to follow something else. Then gold and the USD started to dance together for awhile, as is their custom - until late 2015. Here gold is bolting away from both commodities and the inverse dollar.
So is gold just being inverse to the broad stock market? Let's take a good measure of that with the 2000 stocks of the Russell:
Here we have a little better correlation, especially in the last two months. So gold seems to be responding to something that's now vexing the stock market in general. Let's see if we can narrow that down to something more specific:
In horseshoes, we call this a "leaner", the next best thing to a dead ringer. Here we see that gold has been strongly correlating to the inverse of the financials. It's the
banks that gold seems to be mainly concerned with, not the usual stuff. If you look over the charts of the biggest banks of Europe, you may be shocked to find that they nearly all went into a very bad technical breakdown starting clear back in early/mid 2014 as commodities were swooning and their debt and derivative books were taking a beating. By late 2014, gold may have taken note, because it was then where gold sharply broke away from the commodity complex as shown in our first chart above. Now we are seeing the bank stocks being decimated and gold responding in kind. By virtue of commodities being the flavor of the era in the malinvestment cycle, gold has ironically become the anti-commodity.
This gold/bank correlation seems stronger with the US banks (chart above) than with the uglier European bank charts. This suggests that gold is more concerned with spill-over from the European borders, which do not stop the flow of digital information on the derivatives superhighway into every other big financial in the world. We keep hearing that all the markets are being controlled by oil. But, if you look at gold/oil you don't see the gold/bank correlation at all. It's as if gold isn't focused on oil, or any one problem or bank, but on the
connection webs involved - that is to say derivatives.
But what about the great inflation/deflation debate with gold? Isn't that supposed to control what gold does? Well, nowadays it's pure moronic nonsense. It really misses the point. All of the out-of-control debauched currency is in one of two locations. It is either residing in financial institutions or out on the street chasing goods and services. Right now, with the lowest money velocity since the Depression, most of it is sitting in financial institutions, which are all tied together via exposure to commodity operations and related over cooked derivatives. Many are going under and writing off debt. If it weren't for Faber's
"Zero Hour" phenomena where we have reached the point of zero economic return for each new Fed dollar of debt, the market would say "no worries". But we have reached that point. That's deflation, fixable only by frantically throwing more printed money at a failing process and failing banks, which is bullish for gold, which is now fixated on this very problem.
If all the debauched currency is not in the troubled financials causing deflation, it is out on the street in the form of money velocity, causing inflation. Both tend to be bullish for gold now. So why debate inflation/deflation on gold? They are two sides of the same gold eagle. The point is currencies are imploding, and gold is the only alternative currency to this implosion.
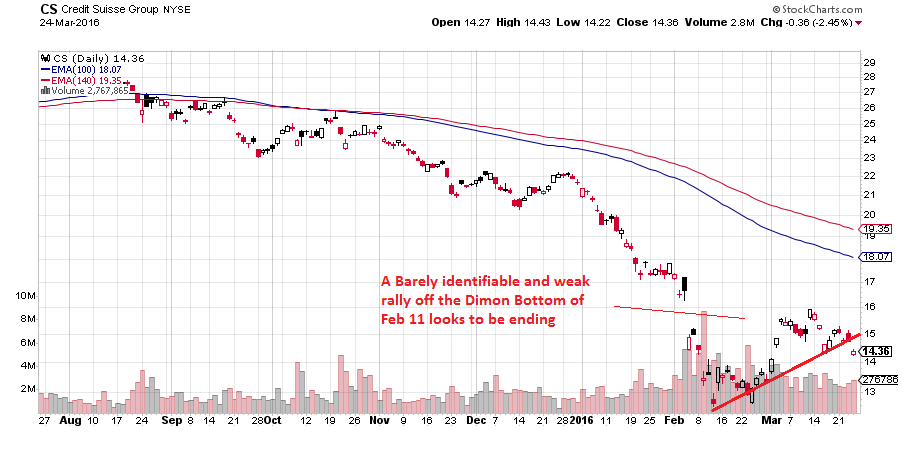
How troubled are the financials anyway? We recently heard a lot about Jamie Dimon doing a massive insider buy of JPMorgan stock. Since then, the Dow has rallied and his buy has been called the "Dimon bottom". On the 2/24
Fast Money on CNBC, bank health was the debate as they discussed the report out by RBC Capital by Gerard Cassidy on the exposure of all the major American banks to the oil industry. His take was that it is a containable problem, and that opinion was echoed by the Fast crew with Dimon groupie Karen Finerman saying that all of JPM's oil exposure amounts to just $0.30 a share.
I am a big fan of insider buying, but this buy will not induce me to buy any JPM. While Dimon expressed much confidence in his bank, his CEO of investment banking just released a somewhat shocking
article titled "It Is Worse Than Anyone Thought On Wall Street"! Daniel Pinto, CEO of JPMorgan's corporate investment bank stated that the bank's investment banking revenues are forecast to be down 25% in Q1 and went on to detail the deterioration in banking. It notes that JPM's performance is better than the rest of the banks (they have, in fact, been the hero of the banks) and the rough Q1 was going to be industry wide. While JPM's oil exposure has a face value of just $0.30 a share, you must consider that JPM has $1.5 trillion in assets and around $70 trillion in derivatives exposure. That's a very dangerous multiplier of 47 on not just oil but everything else they are playing with under duress. I find it interesting to read what they blame for the bad Q1. It's not the price of oil. It is:
...the Swiss National Bank decided to unpeg the franc...higher market volatility, wider credit spreads, lower equity valuations, slowing issuance, a tough comparison period, and uncertainty around the trajectory of economic growth across the globe.
To me, this sounds less like "it's the price of oil" and more like "our derivative book has suffered a great beating". I think the gold market would agree.
This irresponsibility with derivatives thing is, of course, nothing new under the sun. And it tends to run in cycles throughout history. You probably have heard of the 75 year cycle in the economy where the banking depressions tend to occur every 75 years, plus or minus 10 or so. This started right out of the gate for America with the Panic of 1796 which sounds a lot like the invention of the Fed and derivatives when you read the
Wikipedia account:
Frequent instability characterized the United States economy during the 1780s and 1790s. Rampant inflation of Continental Currency during the Revolutionary War gave rise to the phrase “not worth a Continental.” Lacking a stable currency, banks issued their own notes, and calls for stronger public credit led to the establishment under the Articles of Confederation of the Bank of North America in 1781. After the adoption of the Constitution, the First Bank of the United States succeeded it as a de facto central bank...
During this time, speculation was the investment of choice, leading to the Panic of 1792. Former Continental Congressman William Duer raised large sums of money to invest in bank stock and government securities, novel and financially sophisticated assets whose risks many contemporaries failed to understand. Duer soon defaulted on his debts, destroying the savings of many middle- and working-class people
Duer and his small group of prehistoric one percenters then sought to fix things "by applying unprecedented scale to an old concept: land speculation. This set the stage for the bubble that burst in 1797". Was it this group that Ben Bernanke studied and took as heros?
The cycle, which I think is mainly based on one human generation life span's typical 75 year length dividing the young and stupid from the old and wise, was repeated with the pivotal Panic of 1873, 76 years later. Then, we had the massive banking collapse of the mid 1930s dragging clear to 1944, 71 years later. If you take the depths of this banking catastrophe, which was 1934 and add 75 years, we arrive at 2009, where the Fed/banking/derivative problem appears to be dragging on to our day.
The old, wise men who enacted Glass-Steagall in 1933 were supplanted by the young and stupid 69 years later, with the 1999 repeal of this protective legislation that had given us decades of banking peace.
There also appears to be a half cycle to this generational thing. It makes sense to take half the average of these life spans, say 72 years, half of which is 36, and expect that the transformation form stupid to wise happens typically between ages 36 and 72.
David Nichols wrote an
article published at
Kitco May 7, 2013 "The Monetary Cycle And Gold" where he notes this 36 year cycle in currency and banking. If you wanted to assign a starting point to this 36 year thing, the Panic of 1873 would be a good choice according to the teachinghistory.org
writeup:
The Panic of 1873 stands as the first global depression brought about by industrial capitalism. It began a regular pattern of boom and bust cycles that distinguish our current economic system and which continue to this day
They go on to say that this was really the beginning of the money supply capitalism we know of today:
Unlike earlier mercantile capitalism, which is dependent on local markets and periodic shortages of labor or materials, industrial capitalism is controlled by access to venture capital and the productivity of capital investments in stocks
Here began the rule that "money supply acts like oxygen" to quote the
Teaching History writeup. The downturn was especially severe with bank failures triggering soon after October of 1873 and lasting until 1879.
The next 36 year cycle arrives at 1909 and the momentous aftermath of The Great Banking Panic of 1907. This was so bad that JP Morgan, along with other prominent bankers, stepped in with their personal wealth to stop a total freeze up. This led to the creation of the Fed 6 years later in 1913. In 1908, Nelson Aldrich, father-in-law of John D. Rockefeller, convened the conference that investigated the causes of the panic, and the Fed was the replacement for the personal money of Morgan and friends. After 1908, we saw a 36 year period of financial chaos exacerbated by the two wars with Germany and associated bank collapses.
The next swing thing that happens in the banking world was exactly 36 years later in 1944. Here we had another monumental conference called Bretton Woods. From
The Economist article "What Was Decided At The Bretton Woods Conference":
The Bretton Woods system that emerged from the conference saw the creation of two global institutions that still play important roles today, the International Monetary Fund (IMF) and the World Bank. It also instituted a fixed exchange-rate system that lasted until the early 1970s. A key motivation for participants at the conference was a sense that the inter-war financial system had been chaotic, seeing the collapse of the gold standard,
John Maynard Keynes was at this conference arguing with Harry White, Roosevelt's rep, attempting even back then to destroy America's currency:
But while White, as the representative of a creditor nation (and one with a trade surplus), wanted all the burden of adjustment to fall on the debtors, Keynes wanted constraints on the creditors as well. He wanted an international balance-of-payments clearing mechanism based, not on the dollar, but a new currency called bancor. White worried that America would end up being paid for its exports in “funny money”; Keynes lost the argument
No Keynesian funny money, and what happened?
The Bretton Woods exchange-rate system saw all currencies linked to the dollar, and the dollar linked to gold. To prevent speculation against currency pegs, capital flows were severely restricted. This system was accompanied by more than two decades of rapid economic growth, and a relative paucity of financial crises
Then our brilliant President Nixon destroyed Bretton Woods in 1971 and we have had one severe economic collapse after another ever since, beginning with the recession of 1973, where the stock market lost 50%, about the same as the 2008 crash. We tend to think of the 1980s as good, but in the banking world it was one of the worst decades ever. Something came along in 1980 called the Savings and Loan Crisis. If you were to lay all these banking swing events out on a timeline comparing it with bank failures, it would look like this:
The first thing that stands out is that these 36 year periods are characterized either by a great ramp up in banking problems or, as in the period right after Bretton Woods, a near complete absence of banking problems.
Maybe the second thing that stands out is that these past banking episodes dwarf the 2008 Financial Crisis in terms of bank failures, thanks to the invention of the FDIC in 1933 and the bail-out age that started in the 1980s and has now gone parabolic with central bank central planning. But as bank failures have come down, currency soundness and derivative instability have gone out of control.
If you back up 36 years from the Panic of 1873, you arrive at the Panic of 1837, not shown on the graph above, but it was also a banking nightmare causing a depression. While this one isn't as well known as the 1930s, it was as horrible and lasted until 1844. Out of the 850 banks in the nation back then, 343 failed permanently and another 62 failed partially. That was about half the banks in the nation. It was another malinvestment cycle with cotton being the plaything.
David Nichols, who first brought my attention to the 36 year banking cycle, is a fractal analyst, but he does not claim this to be a fractal item of any kind. Nichols said in his article that 2016 will be a top for gold because of the 36 year cycle, looking back 36 years to 1980, the top for gold back then. But the 36 year cycle is all about
banking, not the price of gold. If the cycle repeats in 2016, it will mean some kind of major turn point in banking. So it coincides with the
fractal point that gold is at in 2016 (the start of a large climb, see my
article on that) but doesn't necessarily mean the
top of that climb.
My article pointed out the fractal significance of gold's 4 year cycling with our present gold market looking like a 2X fractal scaleup of the 8 year '70s fractal and 2 year down portion ('75/'76). The Swiss bank USB just published a
USB Technical Research note January 6 pointing out the same thing with both the 4 and 8 year cycling.
A potential bottom in 2016 could be a rather powerful bottom, since together with a four-year cycle low we have also an eight-year cycle low projection for this year. In this context we expect a potential 2016 low in gold to be the basis of a new multi-year bull market.
UBS doesn't say fractals is their reason, but they see the same similarity between the '70s gold bull and our present gold market that I showed graphically in my fractal article:
Pattern wise we continue to see the 2011/2016 cyclical bear market in the same context as the 1975/1976 bear cycle in gold. Keep in mind, in the mid-70s gold lost 43% of its value from its January 1975 top before another gold bull market started into the January 1980 bubble peak. It is amazing to see that with a loss of 45% from its August 2011 top into the early December 2015 low, the decline in gold has more or less exactly the same proportion as in the mid-70s.
The 36 year banking cycle seems to lend itself to being broken up into 6 periods of 6 years each with significant banking happenings occurring in a 6 year cycle.
In any given year, there are several banking problems somewhere in the world, but there seems to be a tendency for the more significant ones to run in 6 year cycles. The latest iteration in 2010 with Greece may be especially foreboding as it could lead to a precedent for a banking contagion as a comment from the ABC article mentioned above explains:
In Cyprus when their banks failed people's savings were confiscated and they were given bank shares as a substitute, nominally at the same value but in fact worth much less. There were restrictions on cash withdrawals. This is the global solution for a major derivatives crisis put forward by the Bank of International Settlements (BIS). It's called a bank 'bail-in'. When the derivatives markets fail and banks go under, derivatives transactions take precedence over all other bank claimants ... Ordinary bank cash depositors go the way of Cyprus overnight. Effectively bank cash deposits are confiscated to pay out derivatives trades.
Since this "game changer" banking swing point, several articles have appeared outlining the dire danger these crazed idiots pose to the rest of us that are not going crazy with derivatives. Ravaging FDIC insured amounts results in government, taxpayer bail-out of the FDIC, so the wealthy accounts over the FDIC limit are becoming fair game for bail-in of any derivatives bust. The new "template" now being legislated - steal from the rich to finance derivative fun of the idle filthy rich. They seem to have a seared conscience about stealing from our bank accounts. Didn't the feds shoot Bonnie and Clyde and their stolen car full of holes for this?
This is what we used to do to bank robbers. Now they are Vice President In Charge of New Templates at Big Bank International. As a
Huffington Post piece phrased it "Bail-Out Is Out, Bail-In Is In". No wonder gold appears to be responding to all this. Criminal lunatics are taking over our banks, and the definition of money is changing. How far we've come in one generation since 1934, when Clyde Barrow was shot for stealing from banks, and they enacted Glass-Steagall to erect a wall between our deposit banking and the young and stupid.
Now it's OK to steal from those awful rich, meaning anyone who is capable of creating good jobs in a free enterprise economy. They apparently are there just to provide funds for derivative shenanigans - funding free economic collapses and advancing socialism. And we wonder what's wrong with the economy.
Putting one's money in a bank has always been an investment contract. When you sign to create an account, you are legally making the bank owner of the funds to do with as they see fit. Your deposit immediately gets lost in a maze of loans amongst many banks. Of course, banks have typically been about the business of investing your money in the interest world to give both you and them a little profit, and they give all your money back whenever you say. That's changing.
With the new templates, depositing with banks is becoming more like investing in the derivatives world. Only you don't get any gain at all, just guaranteed loss in our new world of zero or negative rates. Either you get a little loss with the rates, or a big loss with a blowup in derivatives. This is not a good deal except for those playing with derivatives. What Bonnie, Clyde, and John Dillinger did was illegal. What Joe Derivatives Junkie is doing is perfectly legal. The definition of money is changing, and gold may be picking up on that.
As for the six year or 36 year cycles, I really don't think this is a fractal thing, and I am puzzled as to why this would happen. I can only equate it to the 7 year debt cycle that I showed in my
article "A Study In Crashology" that I wrote back in October. The
UBS Technical Research note also shows this 7 year cycle. In fact the title of their piece is "The 7 Year Cycle In Equities Is Rolling Over - Buy Gold". The 7 year cycle that I discussed was only concerned with the debt world, but there is, of course, a very strong correlation with equities. In my
article "When The Canaries Die, Get Out Of The Mine" I go over the 7 year Shemitah cycles and the 7 periods of 7 years each that make up the 49 years between the Biblical Jubilee years of debt release.
As I showed in the article, big things tend to happen with debt and Israel in the Shemitah and Jubilee years. And it is very similar to the 36 year banking thing. Hmmm - banking and debt. They could be related. Both numbers, 6 and 7, are very significant Biblical numbers. This year, 2016 is both a 49 year Jubilee year and a 36 year banking cycle year, which is a very rare coincidence. Even if you were totally oblivious to all our boiling derivatives problems, banking troubles, and ugly market signals, you would have to be a little concerned about this cycling phenomena, no matter what you think may be causing it.