Saturday, July 31, 2010

SinoCoking Stirring Again?

China's SinoCoking (SCOK) is an adventurous stock having been shot up to $2000 and change during the year 2000 period, when anything with a good story and no money went to the moon. Since then, the stock has crashed to about $12 during the 2002 bear, shot up to over $200 in the ensuing recovery, then slowly wilted back down to $12, where it more or less hibernated during the market bottoming of 2009. To wit: (click to enlarge)

It seems to have been a tortuous exodus after 2004 with very strong handed ownership left by the time of the 2008 fiasco. Now the stock appears to be getting noticed by new buyers. During the huge surge to $200 plus of the early 2000s, the PE ranged between 50 and 100. Now with the stock in the teens and dead as a hammer, the PE is like 3 - but its cheapness is gaining some attention. The insiders like it with a 43% ownership level. Back on June 4, TheStreet.com ran a piece titled "Two Undervalued China Coal Stocks" where they featured SinoCoking and Yanzhou Coal Mining (YZC). Unlike Yanzhou, they do primarily steel making coal and chemical processing coal. The stock appeared to be breaking into another of its gargantuan climbs, but the big China Swoon of 2010 threw a flood of cold water on this move. But, as Jim Cramer said this week, the malaise over China may be lifting soon. With big growth stories, you buy the massacres. This probably qualifies as one. It's doing some nice technical things right now:

Transports Winning The 140 Day Tug-Of-War

Back on July 1, I wrote a post I called "A Ray Of Sunshine". It looked at what seemed to me like some Dow Theory nonconfirmation of the technical breakdown of the Dow. Let's look at what I wrote back then:

A ray of sunshine on an otherwise dreadful market outlook is the condition of the transports and a key tech leader index. These rays really stand out in all the gloom. The debt dominoes appear to be catching up with the rally from 2009. But before we bury the recovery, lets look at something important that is refusing to go along with the gloom so far.
If you put any faith in Dow Theory (and you should) you want to pay attention to what the transports are doing because for a move to be confirmed in the broad market, it must be replicated in the transports. Quite typically, a change in trend without transport confirmation turns out to be bogus. This has been a reliable indicator since the days when the rails were the main transport. In our day, rails have become much less significant, but recently have taken on the role of a reflection of the commodities market. Coal, and about anything you pulverize and haul, move much cheaper in quantity by rail than by smaller truck units getting 5 mpg in traffic. That's a major reason Warren Buffett is buying up railroads. If you look at how the rails are doing in this bad market (check CSX, CNI, KSU) you see they are still in bull climb mode despite the whacking commodities are taking. To isolate the transports as a reflection of purely economic activity apart from the global commodities market, I like to look at the Nasdaq transports because they are virtually devoid of rails:

Here you see pretty much the same thing as the rails show - they both are not confirming the change in trend seen in the S&P 500. The transports are proceeding on an upsloping 200 dma and may have put in a reversal stick on that trend line today. The retail RLX index has been leading the correction down and also has the look of a reversal day being put in at the bottom of a trading channel.
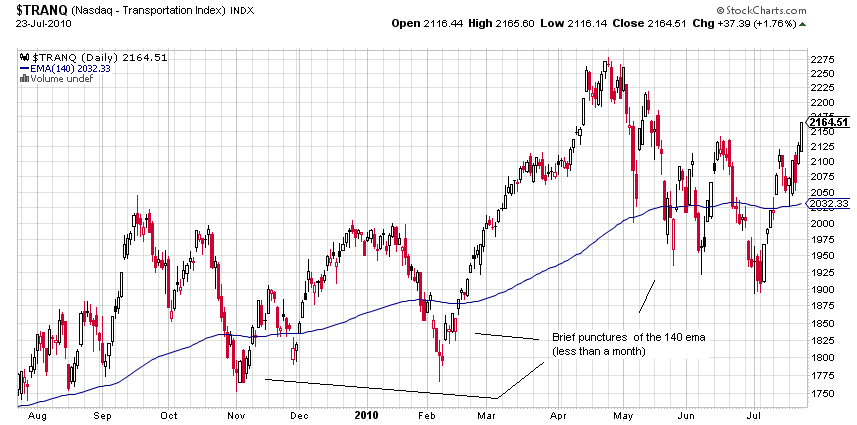
Now to fast forward to the present, we could place a line in the sand as the 140 day exponential moving average (the 200 simple is shown above). The 140 is a good divider of major bull and bear moves if you allow a month or so for transient crossings. In late June, the broad market and the transports seemed to be locked in a tug-of-war with one on bear ground and one on bull ground. Now if we take a peek at the tussle we see this:

The transports have only briefly punctured the 140 for less than a month at a time, and look like they want to drag the broad market, with the bears kicking and screaming, back to the bull market for now:


A lot has been made of the Baltic Dry Index's sharp dive over the last couple months, and this transport index is a reliable leading indicator. But, as Cramer pointed out this week, this index is being distorted by an unusual ship overbuild situation causing shipping rates to decline (see my March 9 post here "Baltic Index On Leave Of Absence?") The other transports, including container shipping, are doing well but are more of a coincident indicator reflecting smaller lead times in economic activity. So we will just have to monitor these transports and take the longer range BDI forecast with a grain of salt for now. The ship thing just doesn't seem to be a plane and train thing.

Saturday, July 17, 2010

Levering Gold's Climb

Gold stocks are a good way to take advantage of a climb in gold because they historically outclimb the metal by a factor of 2 or better. And the stocks tend to run in 4 year cycles of under/outperformance of the metal. They are just now finishing up about a four year under cycle. But there is an alternative. It's the PowerShares DB Gold Double Long ETN (DGP). This is not an ETF, it's an exchange traded note (ETN) and is a debt instrument. This has a big tax advantage as it isn't hit with the 28% longterm collectible rate as ETFs are - only the 15% rate as a stock would be. The recent performance of DGP vs the popular gold ETFs:

This is over a 2X outclimbing of the metal with the same tax treatment as stocks.

Monday, July 5, 2010

Gold's Value Chart ?

A common complaint about investing in gold is that you can't gauge any real value or use for it. As Warren Buffet said - they pay men to dig it up, then they put it back into a hole and pay men to stand around and guard it (paraphrasing). If you look at a stock, you can see its net income and dividend payout and, as a telling chart in one of John Bogle's books on mutual funds shows, this is a very good gauge of its rightful value. The chart goes back over the last 120 years or so and plots the sum of the constituent companies' eps and dividend vs the major stock index. The two curves form a DNA-like spiral and wind up at virtually the same destination after over 100 years of market turbulence ! Oh, would it be that we had such a gauge for the value of gold.

But wait a minute. Maybe we do. If you look at gold as having the purpose of being an alternative currency, you can compare the government printed monetary base with the government backing of that paper with gold. This is something that you can chart historically just as in the above chart for stocks. If you do, you see the following from an array of fascinating graphs at dollardaze.org


Here we see something like the DNA spiral for stocks around eps + dividend payout. Only the spiral seems to be around the confidence level in government printed money. There was a loss of faith in government in the 30s and gold wound up climbing to and overshooting the 100% backing level. There was a loss in confidence in the dollar in the late 70s, and gold again went to and beyond 100% backing. Now we are having a humdinger of a currency confidence crisis, and gold is extremely cheap on this value gauge - not even starting its trek to the other end of the range.

Thursday, July 1, 2010

A Ray Of Sunshine

A ray of sunshine on an otherwise dreadful market outlook is the condition of the transports and a key tech leader index. These rays really stand out in all the gloom. The debt dominos appear to be catching up with the rally from 2009. But before we bury the recovery, lets look at something important that is refusing to go along with the gloom so far.

If you put any faith in Dow Theory (and you should) you want to pay attention to what the transports are doing because for a move to be confirmed in the broad market, it must be replicated in the transports. Quite typically, a change in trend without transport confirmation turns out to be bogus. This has been a reliable indicator since the days when the rails were the main transport. In our day, rails have become much less significant, but recently have taken on the role of a reflection of the commodities market. Coal, and about anything you pulverise and haul, move much cheaper in quantity by rail than by smaller truck units getting 5 mpg in traffic. That's a major reason Warren Buffett is buying up railroads. If you look at how the rails are doing in this bad market (check CSX, CNI, KSU) you see they are still in bull climb mode despite the whacking commodites are taking. To isolate the transports as a reflection of purely economic activity apart from the global commodities market, I like to look at the Nasdaq transports because they are virtually devoid of rails:


Here you see pretty much the same thing as the rails show - they both are not confirming the change in trend seen in the S&P 500. The transports are proceeding on an upsloping 200 dma and may have put in a reversal stick on that trend line today. The retail RLX index has been leading the correction down and also has the look of a reversal day being put in at the bottom of a trading channel.

The leader groups, however, are mixed in their lead/lag condition. A nice one that is still leading is the semiconductor group:

The SOX also looks a little stubborn in going along with the Dow. These are the groups to watch. If they confirm the change in trend of the broad indexes, the market is on to its next phase.

The Russell Indicator Is Looking Weak

Back on May 9, I wrote a post on a technical thing to watch about corrections. The point was that in all good corrections, the small cap Russell tends to lead the charge from the bottom of the pullback. I showed charts of this from corrections in bull climbs and also from the cases where the Russell lagged in bottoming - with a bear phase following for the broad market. Well in our present pullback, the Russell is not leading a charge from a bottom. It is not lagging and it's in better shape than the S&P 500, staying mostly above its 140 day ema and not turning the 140 and 200 to a negative slope. But that's about all you can say for it. The Baltic Dry Index, even with the ship overbuild problem it is having, had been in a nonconfirmation mode on China's Shanghai bear behavior, if you want to consider the Baltic as a Transport Index for China and you pay any attention to Dow Theory. But now it has taken a nasty sharp turn down. The RLX U.S. retail index has been a leader group in the climb from the recession bottom, but now it is actually leading the S&P to the downside ! Tech and the small caps are still wanting to lead slightly to the upside. The leaders are going to have to get their act back together soon to continue a market recovery. They look like the three stooges, seriously disjointed for now.