The Green Shoots advocates see the recession ending and the stock rally as confirmation. But when you look at the history of our recessions compared to our present condition - well, let's just take a look.
What most analysts miss is the debt dimension to our present mess. You can present all kinds of charts on the usual indicators of the recession/recovery cycle as is done in this eye opening article " target="_blank">www.huffingtonpost.com/hale-stewart/the-... showing the end of recession is near, but that may be no sign that the bear market is over! The two events used to be about one and the same. But if you look at our last recession cycle on the charts in the Huffington Post article and study 2001, you see that the indicators had all bottomed, the recession ended, and the really damaging stock market declines were still about a year into the future. This crash was largely debt related. If you go back to the recessions that occurred before we began building our mountain of debt in the mid '80s, you see a different market behavior. For example: (click to enlarge)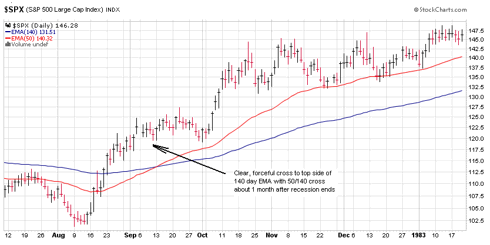
The 140 day exponential moving average is good about separating the significant bull and bear moves if you wait at least a couple months to see if the market stays crossed. This is especially true when accompanied by the cross with the 50. In the '82 recession, you had a clear and immediate 140 cross right at recession's end. Same thing with the '90 recession: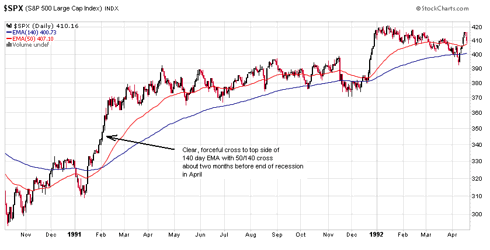
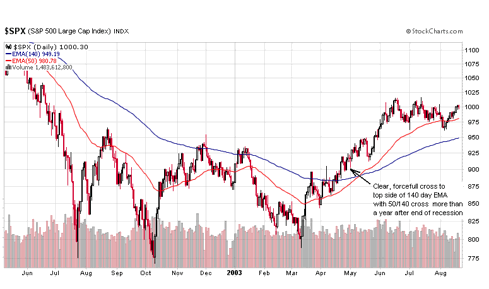
In the '01 recession, the clear stock market bull cross of '03 didn't happen untill well after recession's end in '01 and a horrendous stock crash much later in '02:
Why the big delayed reaction for the stock decline? Could it be that in '82, there was no mountain of debt to complicate things? And the mountain hadn't been built very high yet in the '90 event. It started to be more of a problem in the '01 event. But in 2009, we may be facing another debt induced stock aftermath similar to the post 2001 recession period, when the mountain of debt was a mole hill compared to now.
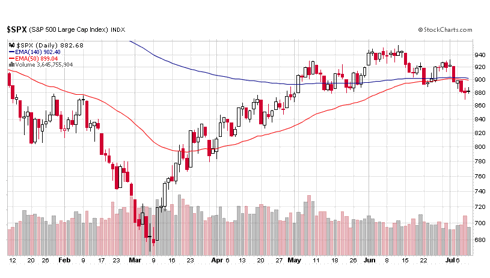
As for our '09 rally confirming the end to the recession and an immediate new bull, the charts don't indicate that. The recession may well be ending, a lot of purely economic indicators including the Baltic Dry Index on the global scale agree, but if you look to see if a multi-year bull market is back like after the above recessions, this is what you see:
Instead of the clear, forcefull crosses to the top side of the 140 after the previous recessons, you see a pathetic attempt that appears to be failing. Given the monstrous debt dimension of our present recession, a failure to break the 140 at this stage could be a very bad sign. If we are to continue the trend of mounting debt level inducing instability and trouble for the stock market in the wake of a recession, we should expect more bear market after our recession ends as this debt/recession chart suggests:
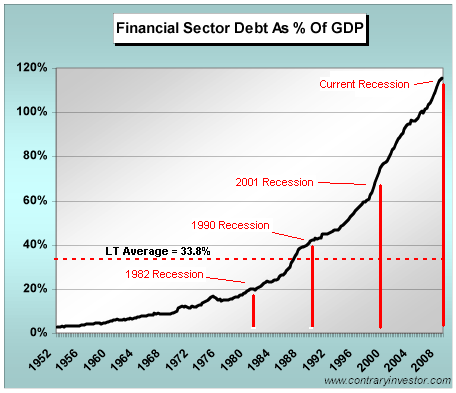
Note that the 1982 and 1990 recessions occurred very near the long-term average debt level of 33.8%, and the ends of these recessions were good for the stock market. By the time the 2001 recession came, we had strayed away from this somewhat stable level and the end of this recession did not end the market's trouble. And now, we are far, far away from this level.



You're obviously not a very good Republican. Don't you believe we will simply grow our way out of any and all debt problems???? Debt is our friend.
ReplyDeleteExcuse me Ralph, are you impuning all this debt mess was the doing of Republicans? The big government Dems has nothing to do with it? I beg to differ and would point your attention to the record breaking spendthrift Dem in office now.
ReplyDelete