We have been conditioned throughout the oil age to count our supply of energy by the barrel. And over the first half of oil's production curve that's been a fair and accurate way of doing it. But as we go through the topping of the curve, things are going to change drastically. There are two big factors that will be doing this and both are little appreciated.
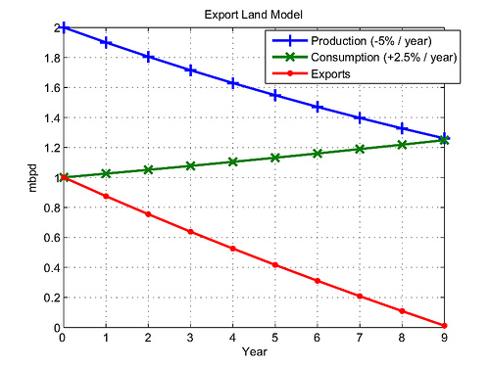
The first is net exports. You have to consider that, post peak, the global production decline rate must be modified by the rising internal consumption rate by the growing economies of the oil producing nations. A rising oil price enriches the producing economies and creates growing oil demand, cutting the amount of oil they put on the market for the importing nations. This has been modeled by Jeffrey Brown, a geologist, and is known as the ELM (Export Land Model). You can read a detailed description of it at en.wikipedia.org/wiki/Export_Land_Model" but the upshot of it is that we, that is the importing nations, will be coming up short on our barrels of energy if we're just counting barrels produced as this ELM chart shows:
Post peak, this graph assumes a global production decline rate of 5% per year with a growing oil consumption rate among the producing nations of 2.5% per year (very close to what these two rates are estimated at). It also assumes that at peak, about half of oil produced is exported (again very close to the current global figures). If you do the math, you wind up with the red line being the amount of oil exported and see the shocking result that it goes to zero just 9 years after global peak production is reached! If we are at or near peak now, this is not good. For the importing nations, the barrels produced will become a more and more distorted measure of energy available.
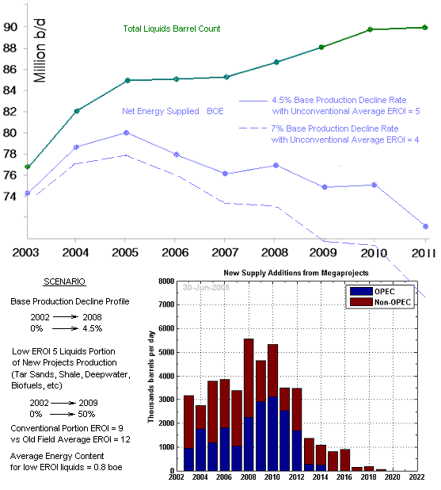
The other big factor that will distort our traditional barrel counting is net energy. For this, I refer you to my Instablog post "The Alternative Energy No One Is Thinking About". If you attempt to draw up a quantified projection of how the makeup of our barrels is changing as we approach the net energy cliff, you could draw something like this:
The green line is the physical barrel count and the blue line is a tabulation of what the actual energy contribution of those barrels is for the assumptions shown (BOE or Barrels of Oil Equivalent). It considers a base production decline rate going from 0% in 2002 to the standard 4.5% in 2008 (in a linear progression). It also considers the EROEI decline as shown both from the gradual addition of the low EROEI components such as deepwater, etc. and a new conventional EROEI of 9 replacing an old field average of 12. The estimates for the base production decline rate range from a traditional 4.5% figure to some more recent estimates of up to about 7%. So I drew two curves to encompass the range between these two figures and also a range on the average EROEI of the added unconventional liquids of between 4 and 5, sort of a best and worst case scenario with these estimate ranges. Both curves consider the new projects additions as shown.
This curve along with the ELM may help explain how, even as we continued to ramp up world production by barrel count about as fast as world demand, the pricing of oil started to go crazy after about 2005. It started as real supply/demand imbalance that attracted a lot of investor heat. It took the end of the civilized world and a collosal fund catastrophe and recession in 2008 to halt it. But one has to wonder just how severely it is going to reheat.
The 6% or so base production decline rate may prove to be overly optimistic. So many of the elephant oil fields have been produced with high water injection, fishbone drilling, and other volume enhancing methods, which induce sharp production falls when the peak is reached, that the older model 4.5% figure may not be realistic when many of the elephants go into decline. This was discussed at Jim Kingsdale's Energy Investment Strategies site (Sept. 1, 2008) where he stated, "When Ghawar declines it may well follow the example of another giant old field that had extremely high artificial pressurization efforts, Cantarell. This Mexican field has been in decline for a couple of years and it is now declining at the alarming rate of 36% per year. The current estimated global decline rate - whether 4.5% or 5.2% - assumes flat production at Ghawar...". I somehow suspect that when Ghawar, and the other elephants, water out, the production will definitely not be flat.


No comments:
Post a Comment