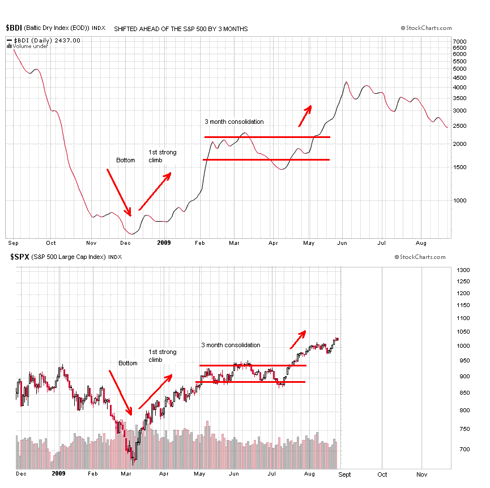
The top chart is BDI shifted ahead of the S&P by 3 months. As you can see, everything seems to happen first in the BDI. It can't predict everything, but it's now suggesting maybe a top for the S&P around September and then a significant decline, or at least a cool off - you can fill in the blank on the lower chart and have a matched pair.
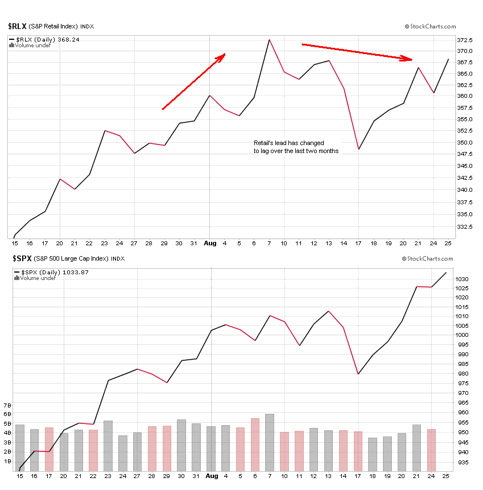
The BDI isn't the only leading edge in the game of follow-the-leader in this market, but it is important. Art Cashin has been harping on it. The other leader groups I've been tracking are retail and technology. You can see how well retail has been leading the broad market in the article today at Seeking Alpha by Wayne Corbitt "Retail:Showing Signs of Distribution". I've noticed the very same thing:

It could be just a short term hiccup or the start of a major trend change. The tech stocks, to a lesser degree, have been underperforming the S&P lately in a shocking change. Is all this signalling the end of the rally and more ugliness by year end? After all, these leader groups have been about the only solid upward indicators. Analysts agree that the market is out of whack with fundamentals, and they're having to buy just because everyone else is. Buying just because everyone is usually happens near the end of a move.
But riddle me this. If the BDI is rolling over so badly, then why are the commodity charts so strong? Copper, oil, and most of them are parting ways with the sickly BDI. Shouldn't they be doing the same thing? Well, the new difference may be investor demand. Remember, there is no investor speculation in the BDI. But there is a broadening move in the world toward getting rid of dollars and replacing them with hard assets.
With the unprecedented debasement of not just the USD but all paper, there is a move to buy and store commodities now, after they've been marked way down, storing them, and treating them as bank accounts that can be eaten or poured into a tractor's fuel tank. That means that strong economic demand for commodities might not be there right now, which would explain the weakening BDI and RLX charts. And it would also explain the weak transports chart ($TRANQ) which has not made the nice new highs since late last year like the S&P, but instead shows lower and weaker highs - a non Dow Theory confirmation. It's important to note that this transport index is virtually devoid of the rails. The transport indexes with a lot of rails show much better results. But the rails are doing well only because of global commodity demand - again, the investor demand difference.
This "speculation" demand should not be underestimated in our current mess. It is becoming a way of doing business. Michael Pettis, a professor at a Peking University is a specialist in Chinese financial markets. He was recently interviewed by DNA for a July 13 article "China Cannot Really Dump The Dollar" where he discusses China's approach to the world's currency problems. He said
In response to the question of whether China could drop the bomb and dump all their dollars, he said, "You can't really do that". They can trade dollars for commodities, impacting the dollar, but the effect is muted by the commodity countries recycling the dollars back into the U.S. But printing presses can dump the dollar, forcing investor demand for commodities as a new, unprintable currency.One other thing the Chinese seem to be doing is buying commodities. But that's just another speculative play. If commodities are at the bottom, they should be selling dollars and buying commodities ... if China grows, commodity prices go up; if it stagnates, prices go down ... By stockpiling commodities now, they're doubling up their bet.


No comments:
Post a Comment