Thursday, July 30, 2009

The Bridge Is Out

Richard Kinder of Kinder Morgan Energy (KMP) was on today's Mad Money show pointing out some important things on our energy policy (or lack thereof) concerning natural gas. Of course you could say he's just talking his book, being head of a natural gas company, but what he and Cramer stressed is critical stuff for all of us. Kinder wrote a piece in the Houston Chronicle this month showing how dangerous it is to form energy policy around nothing but renewables, which seems to be what the administration is bent on, ignoring the fact that they currently make up only 1/6th of 1% of our energy supply. The scale up of these fuels is going to take many years and we must have major bridge fuels already scaled up to get us from oil to sun and wind. But the approach of the village idiot of global energy policy (the U.S.A.) is to punish all workable bridge fuels and promote only the pollutant free energy. All other nations are not this stupid, and America could pay a heavy price in lost power as the oil age rapidy closes over the next 10 to 15 years as this chart shows (click to enlarge)


The blue curve topping out around 2030 shows the world's energy supply from natural gas production, natural gas plus natural gas liquids, which currently gets counted as "oil". See how the gas contribution compares to that of oil, the yellow line? And these curves don't even show the massive new recoverable shale gas in North America, a game changer. The difference between the pricing of oil and natural gas is going to get ridiculous. We desperately need natural gas as the main bridge fuel to get us safely from the dangerous oil mess we're in here in America to the nonfossil future. But Congress is doing all they can to blow up the bridge.

The energy crisis we face is all about timing and EROEI. The energy sources are all there - solar, wind, future ethanols that will work, and our remaining fossil allotment. The problem is that most of the nonfossil alternatives will never have the EROEI to effectively replace high EROEI oil and supply the world's energy and will take many years to scale up to what is needed for oil replacement. The other stuff that will have the needed EROEI will take too long - we will face the net energy cliff edge before they are scaled up to what is needed (see my June 19 blog post "The A
lternative Energy No One Is Thinking About").

That leaves natural gas as the only here and now critical bridge fuel to get us from the cliff's edge to the other side where we will have high EROEI non fossil fuels scaled up and economical.

But even if you did not even consider all the net energy situation (which no one is considering anyway) NG, in addition to being the most energy dense and highest EROEI energy source, is also the quickest and cheapest way to cut all forms of pollution! Compare these pollution rates for the three fossil fuels NG, Oil, and coal:

Pollutant NG Oil Coal:

CO2 117,000 164,000 208,000
Carbon Monoxide 40 33 208
Nitrogen Oxides 92 448 457
Sulfur Dioxide 1 1122 2591
Particulates 7 84 2744
Mercury 0 0.007 0.016

Source: EIA - Natural Gas Issues and Trends, 1998

And also from the DOE, they estimate that 50 % of all air pollution comes from our cars and trucks (80% in cities). They say that an immediate switch to NG powered vehicles would:

cut CO2 by 25%
cut NOx by 35% - 60%
cut carbon monoxide by 90% - 97%
cut other nonmethane hydrocarbon emissions by 50%-75%

And we have the technology already developed to do this! You can switch your vehicle over with a trip to the mechanic and about a $1500 bill. They commonly do this in many other nations. Considering that NG engines run so much cleaner that the oil stays pure and engines last 2 and 3 times as long, that switchover bill pays for itself, not to mention that domestic nat gas is less expensive per mile even during times of geopolitical peace.

What other government programs looking at putting windmills on cars soaking up billions of our tax payer dollars would immediately cut pollution by the percentages above? None.

But they ignore the Pickens Plan and would rather fill the air with unnecessary pollution from our current dangerous imported oil as we drive to the edge of the net energy cliff.

Monday, July 27, 2009

LABL at a Strong Technical Juncture

Multi-Color Corporation (LABL) is what I call a "clothespin stock". They are a dull, boring little company that makes non-trendy stuff we use but don't get too excited about (like clothespins). If these companies execute well and their stock gets whacked in a market event, it can present a nice undervalued buy that is not very sensitive to chaotic market ups and downs and product cycle changes. Sounds nice in this kind of market. LABL is such a stock. They make labels of all kinds for office and home use, which you'd think would be suffering in this recession. Well, since the start of '07, their gross profit (ttm) is up 50%, operating income is up 28%, cash flow from operations is up 37%, and even net income is up 18%. Sounds like the numbers you hope to see from a kick-ass growth stock in good times. You currently get the stock at a price/sales of 0.6 and price/cash flow of 6.6 vs 1.9 and 18.9 industry group averages. Technically, you have this:
(click to enlarge chart)


Despite the good numbers, the stock has been smacked from 28 to about 12. But as the chart shows, there seems to be a clear case of seller exhaustion with this one. It was dead as a hammer over the intense February selling. Also it has been ignored by new buyers so far in the rally - a nice combination.

Saturday, July 25, 2009

Margin Debt Catharsis?

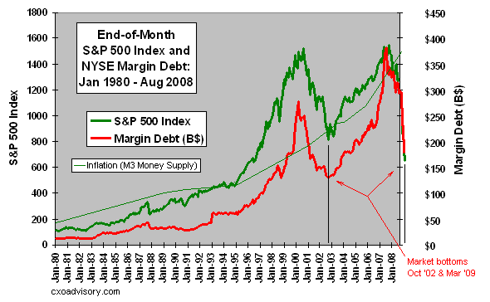
The level of margin debt used by investors at the major exchanges has always been closely correlated with market tops and bottoms. It gets to high levels at market tops and vice-versa. There is usually a clear, snappy, climactic turn at a major market bottom. (click to enlarge charts)

This is a chart from CXO Advisory I have modified to show the March 9 bottom event and also the relation of inflation as measured by the M3 money supply to all this, which is quite important really. The chart obviously shows we are now way out of whack with our stock market relative to the money supply curve.

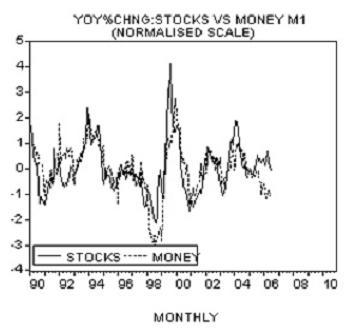
If a chartist arrived here from Mars, not knowing anything about the financial pickle we've been in, he would surmise that this M3 thing seems to push everything else around. The stock market follows M3 and the margin debt follows the stock market. The Martian would not be the only one with that opinion. Dr. Frank Shostak, Professor of Economics, wrote a small treatise on the relation between money supply and the stock market where he begins by asking "Is it true that changes in stock prices are predominantly set by changes in money supply?" Here, he discusses alternate points of view and concludes, "Observe that what drives the entire story however is the original loose monetary policy of the central bank - the creation of money out of "thin air". The causality therefore is from money to stock prices and not the other way around. The whole story is reversed when the pace of monetary pumping by central banks slows down." And the correlation is pretty good as he shows in this chart of money supply in the South East Asian stock markets:

Perhaps we should just look to money supply as the target for the S&P 500 whether that's right or wrong policy. In all this chaos, Helicopter Ben and the powers that be seem bent on fixing everything with the magic wand they can control until a currency crisis eventually stops them.

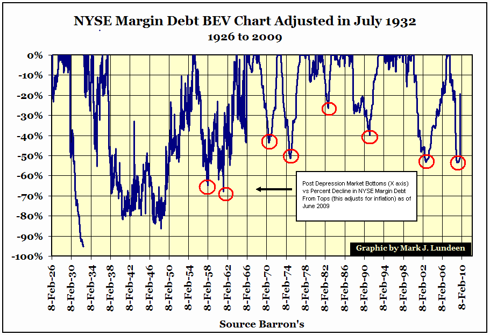
So are we making a sharp turn in the Dow back up to chase down the money supply as shown in the first chart? Well, we seem to be making a snappy turn when you look at this margin debt chart:

This "BEV" chart by Mark Lundeen zeroes all the tops of the margin debt climb to adjust for inflation and just shows the percent declines in the moves down. The bottoms of virtually all the post Depression selloffs are marked by sharp turns in the margin debt declines. When viewed in this context, our current end of the world looks more like a garden variety snap turn back up to chase down the money supply curve. But in the present case, we are more out of whack with money supply than usual, and the turn is snappier than normal - the snappiest since 1965. The margin debt level is quickly back up to worrisome levels, but when viewed in the money supply context of the first chart above, it may just be getting started in the next leg up.

Friday, July 24, 2009

Dow Theory Confirmation of Breakout?

Since early June, the market's move off the bottom has been idling at a red light at a hazardous intersection (see my June 12 blog post). There are several things that make this stalling action a no man's land turning point between bull and bear, one of which has been lack of good confirmation of technical progress by the transports. Charles Dow authored a series of letters around 1900 that posited what has become known as Dow Theory. It became known and practiced because it works really well. It predicted the start of a bear market in late 2007 and now is at an interesting juncture. The basic confirmation principle says that any meaningful chart progress down or up by the market at large must be duplicated by the transportation stocks or it is suspect. If you have the S&P 500 going one way from a significant technical juncture and the transports going the other way, the theory suggests that the broad market will change direction.

Right now, the transports are having a tough time getting their ducks in a row. There are several transport indexes with some lagging the S&P badly and others lagging very badly. However, in the last week or so, some indexes have come alive and confirmed the S&P's breakage of key technical barriers while others still look very weak and nonconfirming. What is the source of the discord? It's the railroads.

About a year ago, the investment community was abuzz about Warren Buffett aggressively buying the railroads. What's up with the rails? Well, that's a subject for another post, but one key thing is the end of cheap oil. In North America, we are embarking on projects like the replacement of foreign oil with coal, tar sands, ethanol, and other fuels that are mined, scraped, crushed, grown, and hauled in lieu of simply piped. The escalating price of oil also places some aces in the hands of the rails because they can transport tonnage using less than 1/4th the fuel used by splitting the load up onto trucks and placing them in stop and go traffic. As fuel cost, not to mention conservation efforts, become a sore point, a rising oil price induces a lot of leverage in the transport biz in favor of the rails. And one thing Buffett likes about these companies is that their business has very high barriers to entry. It's very hard to start up a big rail line.

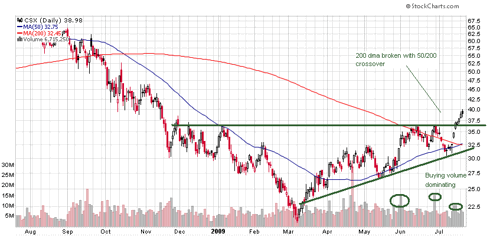
The railroad stocks began climbing in the wake of Buffett's buying, then were crushed with the market. But just over the last week or so, they have come back to life like CSX: (click to enlarge charts)

This explains the wide difference in the transport indexes:

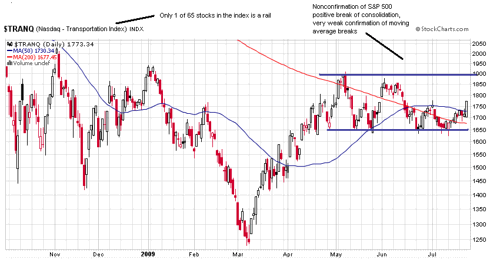
Here we see the Nasdaq Transportation Index seeming to shy away from confirming the S&P's breaking of the 200 dma, the 50/200 cross, and the turn north out of the consolidation of the last 2 to 3 months. This index is made up of 65 companies with only 1 rail. What happens if you put a bunch more rails in?

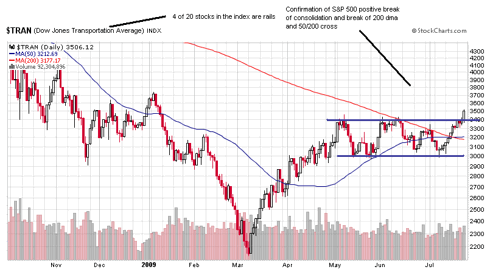
So much better! This is the Dow Jones Transportation Index composed of 20 companies with 4 major rails - 20% of the index. Until 2 weeks ago, even this version of the transports was not confirming the good technical work of the S&P 500 having stayed below the 200 dma with the whole consolidation pattern well below the January high for the year. But with the help of the railroad breakout, that is changing.

Which version of the transports should we go by? Charles Dow might say the rails of course. That was about the only industrial transportation in his day.

Tuesday, July 21, 2009

Buffett's Railroads Revisited

Last year about this time, one of the big buzzes in the investment community was Warren Buffett's aggressive buying of the railroad stocks. Everyone was scratching their heads over this until they began seeing some neat things about the old stoggy rails.

For one thing, perhaps the biggest thing, the escalating price of oil puts some aces in the hands of the rails. Trains can move tonnage using only about 1/4 th the fuel it takes to split the load up on trucks and put them in stop and go traffic. The end of cheap oil has also placed more of a premium on coal, and the rails move the vast majority of coal. Also, ethanol can not be shipped in our conventional pipeline system, so the aggressive mandated ethanol production growth curve works in favor of rail tanker cars. As we must dig, scrape, grow, and haul our oil instead of piping it, the rails will expand into the role of energy supply.

One of the things Buffett likes about the rails is the high barrier to entry into this business. It's hard to start up a big rail line. As more want in, the few established lines can ride the gravy train all by themselves. No dilution of the profits among a flood of upstarts as with a hot new tech toy.

Well, that was last year. The rail stocks started to climb, then were demolished along with all investments. But the facts haven't changed. So the rail stocks are now a very good way to participate in a recovery. Right now they are doing some nice breakout moves like CSX:


Friday, July 17, 2009

Fractal Early Warning System?

The earnings season has gotten off to good start with a very positive market response, even though many point out that bars have been lowered so much, the market's reaction may not be meaningful. I've never looked to earnings reports as guages for a stock's movement. As you see over and over, the market will go up in spite of bad news or go down on good news (buy rumors, sell news). Why is that? The market is a discounting mechanism and digests far more news than you or anyone can be paying any attention to at any one time. The market has a way of moving to the tune of other, more mysterious things. This is why technical analysis is so important. It reads the full digest of all the news plus all the mysterious stuff.

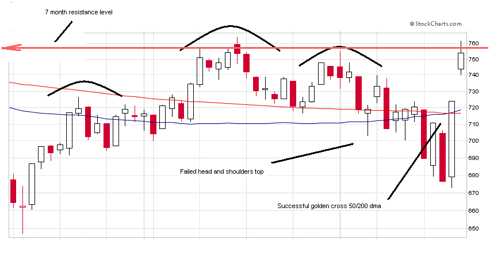
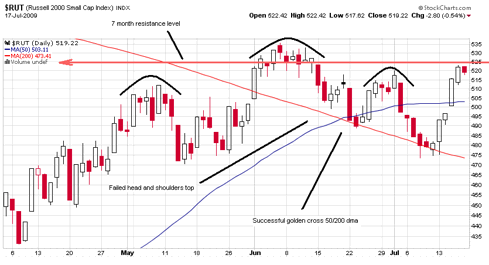
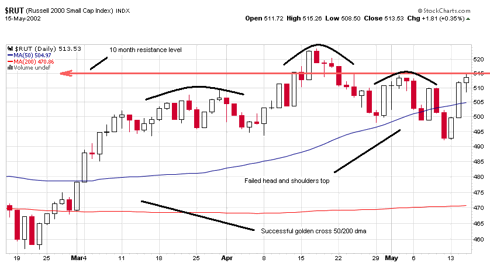
Right now, the earnings reports and the charts are putting investors in a much better mood. They are celebrating a defeated head and shoulders top formation that had so many so worried. And the glorious golden cross has received much attention too. Altogether, things have improved like so: (click to enlarge charts)

We appear ready to blast through the long resistance level going back to the beginning of the year. Does the above chart look familiar? In case it doesn't, I'll show you the current chart of our market:

It is a repeat of all the major components in the previous chart, which is for the same Russell 2000 at the end of the major bear market rally that ran to mid 2008. The very next trading session began the market's huge collapse. The two charts are very similar in a kind of fractal way. The failed head and shoulders is more pronounced in the S&P 500 chart. This sharp up move at the very end of bear market rallies is a usual pattern as was mentioned by Peter Cooper in his July 16 article at Seeking Alpha. Did it occur at the end of the big rally going into mid 2002 before the big drop then?

Pretty much. There were a few subtle differences. It was a 10 month resistance level instead of 7 months. And the golden cross was back in January and the market had been above the crossed 50 for months. And the upsnap at the very end was a little more muted. But the major components were there.

But the macro-economic conditions are much better than these other cases you may argue. The recession is about to end for Pete's sake. Well, may I remind you that when the steep plunge in late 2002 transpired, the most powerful of the entire bear market, the recession had been officially over with for nearly a year!

Am I saying sell everything Monday morning? Well, no. But if the market doesn't break the resistance and comes back below the 140 dma, I'm going to get even more defensive than I've been since early June.

Wednesday, July 15, 2009

More Confusion

In case you're not confused enough on the market's direction, let me toss this at you. Lowry Research, mentioned in my previous post as predicting a breakdown below the March low, is a very respected company with a good long-term record of getting it right. They've been independently checked on their calls from 1950 to 1975 according to their home page, with an overall market gain of 2 1/2 times the market's performance. Paul Desmond, the president, is the 2009 Technical Analyst Magazine Technical Analyst of the Year. Their proprietary buying power vs selling pressure method apparently works well. But if you take just the buying power half of that tabulation, it correlates to historical lows like this:


Buying power is at the low point of March 9 this year, which is the lowest since September '42. What happened after September '42? The market went right into about a 30% climb over the next 8 months, about like it did at the March 9 low point - both historically fast climbs. The lowest buying power ever was a smidge below this level in February '33. What happened in February '33?


Just one of the most powerful bull runs in history from February '33 to early '37. Lowry's methods compare the buying power against selling pressure to predict the market, and when they do that they get the widest span between the two numbers ever calculated for the current market - indicating a severe downturn. but obviously if you take just the buying power number by itself, it seems to be saying buckle your seat belt, we're igniting into a severe climb.

Are we confused yet? It should be noted, however, that the buy signal interpretation of Lowry's buying power ignores the fact that new bull markets from historic buying power lows always run for years before a next historic low - our present market has put in a buying power low March 9 around 96 then soared in the rally before falling back to this low just 4 months later. Per Paul Montgomery, who updates Dennis Gartman's newsletter on Lowry data, "According to Lowry's, since their data base began some 76 years ago, no new bull market has ever given up all its initial gains in Buying Power, which the current market has done." They see the March 9 low as a stop on the way to the real bottom. If this really was a bear ending rally, the buying power would keep building instead of quickly evaporating.

At least all these signs I've chronicled agree with my basic technical analysis that I detailed in my June 12 Seeking Alpha post- we are at a red light in a big, dangerous intersection waiting to turn. But which way? I tend to favor the basic leadership pattern mentioned in my previous post. It is still intact and functioning and indicates a north turn. But even this sign has a fly in its ointment. The transports are also a critical leadership group, or at least a confirmation group according to Dow theory, and if you look at this chart, you see that the transports are not participating in the recent strength and are a long way from confirming any positive development in the broad market.