Wednesday, March 24, 2010

Gold at Pivotal Point

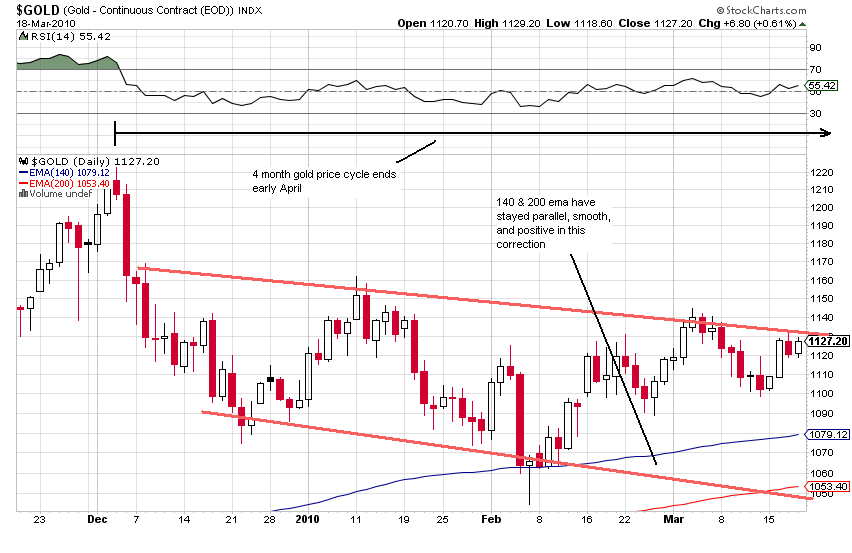
In its correction since December, gold now sits at a crossroads between bull and bear. As I pointed out in my post on gold a few days back, the fractal analysis has gold nearing the end of a typical 4 month phase (down since December) and at the turn point into a new cycle (up into a fast climb to over $2000 into early 2011. Technically, we see gold perched atop the critical 140 day ema that is one of the best ways of dividing bull and bear markets: (click to enlarge charts)

Here we see gold's RSI entering regular buy zones just below 40 with those points correlating very well with the 140 ema support level. We are smack on one of those right now. We will either dive through it, perhaps linked to a new leg up in the dollar, and go toward the bottom of the correction's megaphone , or we will turn and break the formation with a swift move up. This megaphone breakage would also be a break of a fractal energy level stronghold of $1128 - the shoulder level of the head and shoulder top shown. The odds would seem to favor a hold of the 140 ema, which would also be a completion of the larger scale inverse head and shoulders bottom to the correction. But who knows. Until this situation resolves itself, new positions in gold may be a little dicey. Gold does not have to dance to the tune of the USD, but to the extent that it does, it is linked to a possible turn there too as this article on China over at safehaven discusses.

Tuesday, March 23, 2010

The Shoe Bull

As Jim Cramer alerted us to on Mad Money yesterday, there is a bull market in shoes right now. As usual, he zeroed in on "best in class" which he deems as Nike. I like bull markets but I don't like high profile, so I'll offer two shoe names that Cramer would frown on - Rocky Brands RCKY and Crocs CROX. Well I guess Crocs was high profile awhile back, but Rocky is quite obscure.

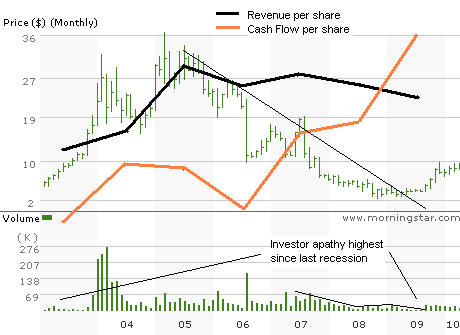
RCKY makes a lot of cowboy boots - very expensive ones. That's one thing that you'd think would be getting absolutely killed in this retail environment - completely needless spending by the average Joe. But just look at this chart: (click to enlarge charts)

These people know how to survive, and the stock price is showing the first twitches of emerging from the coma investors have put it in. It was dead as a hammer across the big market event of March '09 - about all the weak hands gone. I remember this one catching my eye back when it was around a comatose $4 over the course of the July market sell-off last year, but I never got around to buying it. The short term technicals currently look good:


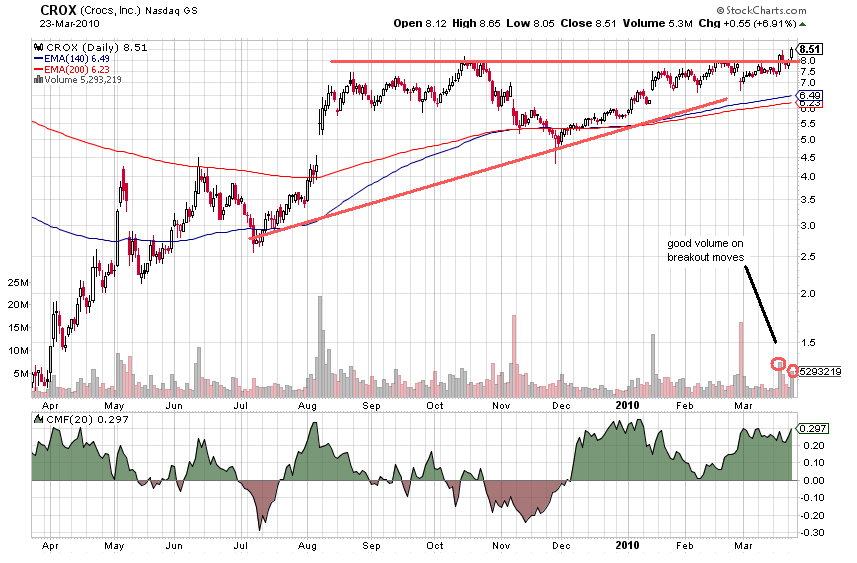
There is a resistance level at $9.5 that will soon break if it follows the lead of CROX and NKE. CROX has been working on a similar formation:

I wrote up a buy case for CROX back on January 16 and it now looks ready to move above $8.

Friday, March 19, 2010

Gold's Technical Condition

Gold has been in the doldrums since early December, and anti-inflationists are pounding the table for gold's demise. Inflation may or may not be a problem anytime soon, but to me that's not the question. Gold climbs correlate with a lack of fiscal integrity regardless of whether this winds up causing inflation or any other particular problem.

Gold's technical condition (including its fractal condition) tells you more about its direction than trying to figuring out inflation, deflation, or conflagration. Going outside the charts, we see an abundance of fiscal angst being highlighted by the ongoing bailouts, including the one for our dysfunctional healthcare system that many believe will be a fiscal nightmare. But just staying with the charts, we see some interesting things: (click to enlarge)
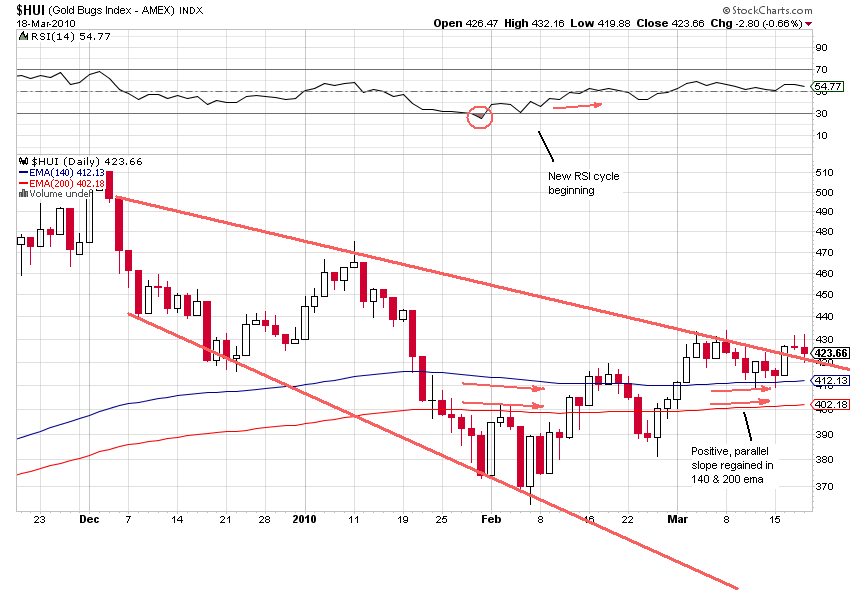
Here we see a clear downsloping megaphone formation for the HUI index of gold stocks formed over the four months of the correction since December. These formations tend to break violently when they finally break (either up or down) out of the boundaries. You could think of a megaphone as announcing that a big move is coming up. The gold stocks have cooled enough to put a slightly negative slope in the 140 and 200 day exponential moving averages. But as we approach a possible exit point from the megaphone, the moving averages have regained the parallel and positive slope they've been in for months, signaling that the gyrations inside the formation may be about done with. Also, a clear oversold condition has been registered in the RSI and a new RSI cycle seems to have taken hold.

Looking at the gold price chart, we see a more subdued megaphone:

The moving averages look sturdy despite the long correction, suggesting a very powerful trend and a strong climb once the correction ends.

The fractal students of gold have been very accurate on gold's direction in recent years. They project late March as a major turn date, just as they did prior to last July (the beginning of the big climb into December). They point out that gold has moved up and down in 4 month units - either single 4 month units in one direction or a mild 4 month move followed by another more severe 4 month move in the same direction. It's interesting that our present down move hits its four month mark in early April, just when the above technicals are suggesting a new move coming, and in the aftermath of the upcoming congressional actions on healthcare. Storm-chasers beware - it could be a perfect storm gathering for gold.

The rest of the market has had to deal with all these known problems as well as the fiscal dominoes abroad out of Dubai, Greece, and every other place the debt roaches are hiding; but it has somehow chosen to ignore all that. So we could have the 2004 condition of gold and the S&P 500 both moving up (although '04 was a little flat and boring). Of the two, I would say gold has the best and by far the safest performance outlook.

Wednesday, March 10, 2010

Baltic Index On Leave Of Absence ?

The Baltic Dry Index is usually a good first sign of future stock market direction, and I pay attention to it. But there is now a disturbance in the force that makes it so reliable as recent stories in the WSJ and CNBC have pointed out. Three years ago, when the BRIC ports were insatiable, a frenzied boat building spree got under way. Now the recession has cooled that appetite and the 3 year lead time for getting boats in the water has a gross over supply messing with the rates that the BDI goes by - making the index overly bearish looking.

As I wrote in the previous post on market leader groups, the BDI is currently the bearish one. So if you discount its effectiveness until the boat situation normalizes, that leaves a much more bullish picture of rotating leader groups in a stabilizing bull market. As Cramer opined on his show today, the financials were the most severe climbers in the bottom gyrations of a year ago, but have lagged over the last few months, letting retail and other things steal the show for awhile. But after a very bearish island reversal that fell back below resistance back in October, the XLF is threatening to bust that resistance and be the star again: (click to enlarge)

Friday, February 26, 2010

Market Leaders Mixed On Future Direction

Early this month, the market's leader groups that have been faithfully leading the broad market to higher ground for a year now looked as if they were having a change of heart and were leading a charge to the downside. Since then they have partially straightened up and are partially flying right again. I say partially because, of the three groups I pay attention to (retail, tech, and the Baltic Dry Index), one is strongly bullish, one is neutral, and one is worrisome.

First let's look at the broad market, the SPX (click to enlarge charts)
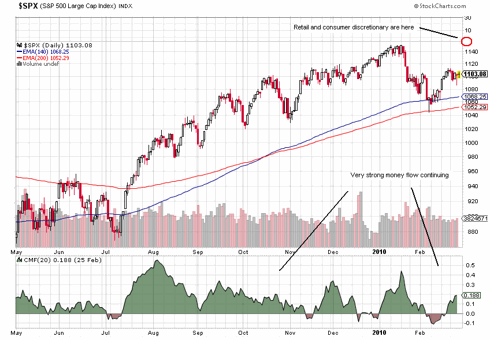
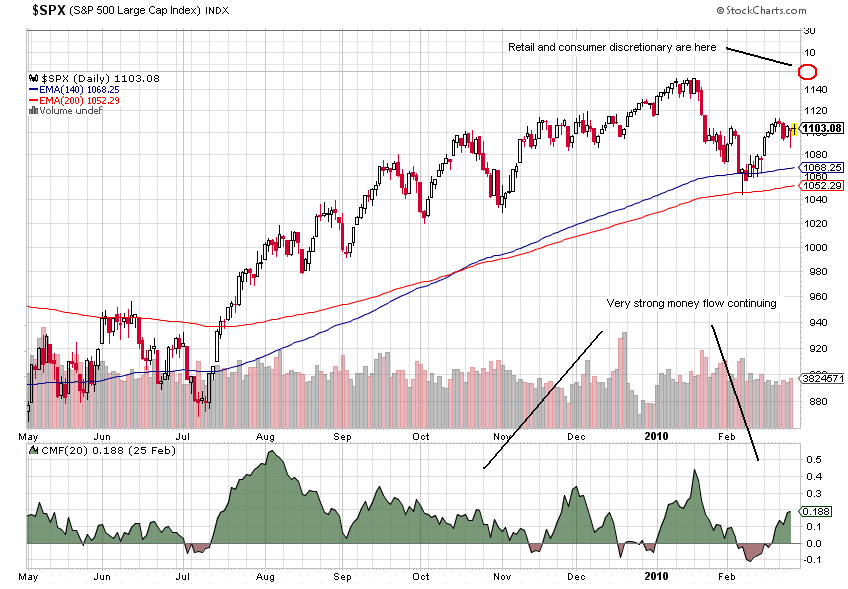
The leader that's bullish is retail and consumer discretionary spending as the first chart below shows. In this stage of lousy housing, lousy employment, and a lousy consumer, this would be about the last area you'd suspect of being a general leading a charge upward. Go figure. But this group has been right about the market's direction for a year. In addition to the consumer's leadership, the SPX has nice, positive divergence in the two key moving averages, the 140 and 200 ema, and the price action is staying nicely above both throughout the pull backs - a very good sign.

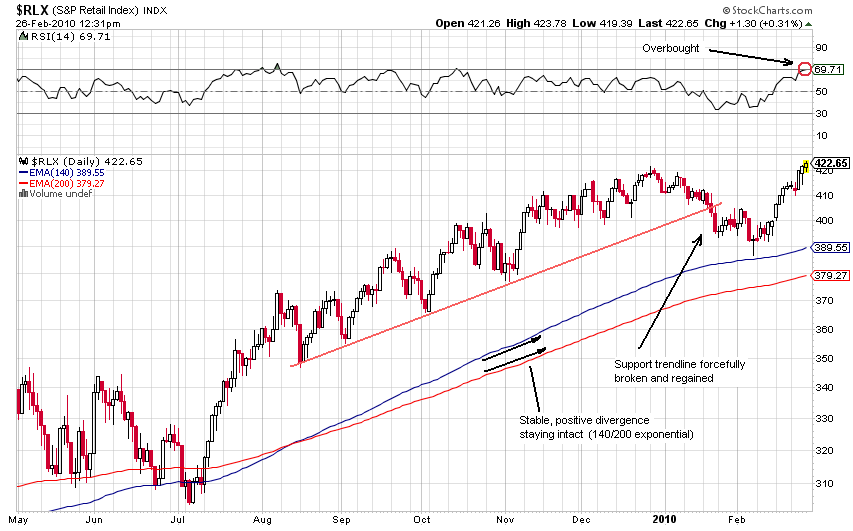
The bullish leader of the three is retail and consumer discretionary (RLX and XLY)
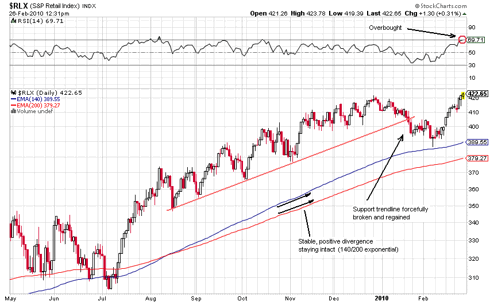
Here we see the index way ahead of the SPX in coming out of the recent downdraft even to the point of being at a new high and currently overbought on the RSI ! The market somehow doesn't seem think the U.S. consumer is all that crippled. A nice, smooth positive divergence in the 140/200 is ongoing.

Second, look at the tech stocks.
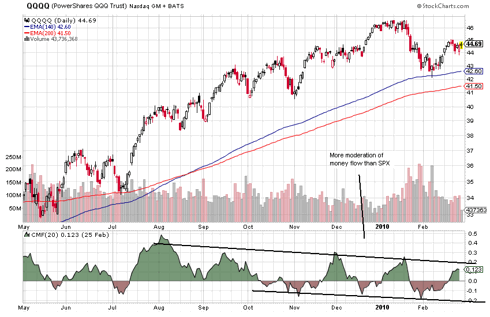
This group is neutral with the SPX to maybe slightly lagging considering the money flow condition, which is cooling. This all paints a picture of maybe some leadership rotation in a more sideways market - a point that Jim Cramer has alluded to.

But the third index is a little more worrisome, the Baltic Dry Index.
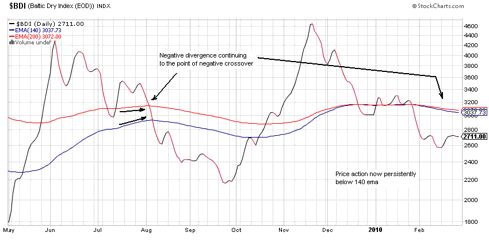
Here we see a much different look with the 140/200 ema. Even more worrisome is the fact that this one is the early warning system for all the others. It had better get back above a climbing 140 ema soon. Both the BDI and the Shanghai Index are all about China, but the Chinese stock index doesn't look this bad with the price action staying above its 140 ema. If you check out the $DJSH, you see a moving average picture more similar to the SPX albeit lagging behind it a little. Maybe all that is a little over-reaction by everyone in response to China's recent move in the direction of putting the brakes on their economy. But in the bigger picture, this is a good problem to have.

Wednesday, February 10, 2010

ARM Holdings Surfing The Smartphone Tsunami

ARM Holdings (ARMH) is a UK based chip designer that is parlaying its licensing and royalty talents into the smartphone revolution. They are not a high profile stock like AAPL, QCOM, RIMM, or GOOG; and were snubbed by Cramer's Smart Phone Index initiated 8/12/09. But ARMH has out performed all of these names and the index since last June, up 53% since I wrote a post about them and the smartphone hurricane on July 1 (click to enlarge)

In response to a viewer question, Jim Cramer has apologized for not having ARMH in his index, saying it should have been included. Back then, the valuation was a pain and had to be overlooked for a value investor to love the stock. After the climb since then it is even more of a pain: price/sales 8.0, price/cash flow 27, PE 70 - ouch! ARMH's eps is pretty flat over the last 10 years and, obviously, a lot of the tsunami future has been pumped into the stock price now. How much more can it take? If one had bought some back in June, one might want to take some off the table. But this stock is probably a buy on any sell-off that might send it to better valuations.

Bears on the stock point out that royalty rates are tending to come down as everyone buys a smartphone and more pricing pressure is induced. But this is countered by Morningstar's analysis that "as demand for outsourced chip designing grows, we expect this capable chip intellectual property (IP) designer to expand its footprint in more markets..." (other than the mobile market). But this strays from the tsunami. The commoditization of the smartphone may have some hard-to-predict investing consequences even as the tsunami itself advances - much like the internet revolution has left most publicly traded plays behind in its dust over the last 15 years. Here, an investor has to respect the technical condition of the related stocks and recognize when a good trend is breaking down or gearing up.

Saturday, January 30, 2010

Will Rising Interest Rates Kill The Gold Bull ?

The whole flap this past week over possibly replacing loose money Ben Bernanke with a dollar defender like Paul Volcker makes one wonder just what will happen to gold when the interest rate handle is eventually cranked. There are two possible investor reactions: "Oh my, they're going to defend the dollar, I'd better sell my gold" or "Oh my, there's an inflation threat, I'd better buy some gold". Most of the commentary I've been seeing tends to be of the first type - if they start to defend the dollar, gold will go down.

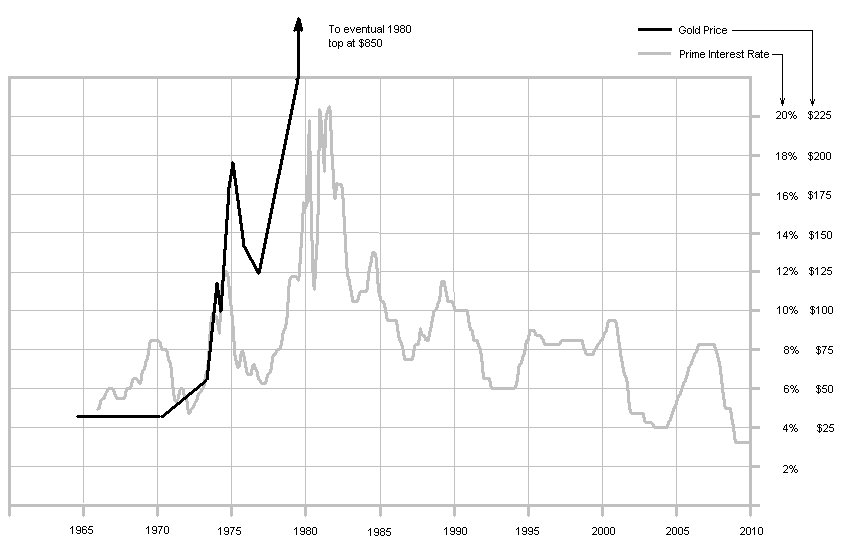
What happened as the previous gold bull came to its end in the 1970s? Well, if you chart the two, the USD vs the prime rate over the end game for gold's bull market back then, you see this:

Clearly investors seemed to be thinking more along the lines of choice #2 above - rates and gold responding in unison to an inflation threat. The interest rate climb, which took place over nearly 10 years, ignited gold from $35 to $850. The dollar eventually did a huge climb to match the interest rate climb, but this was many years behind the rate climb - beginning in 1980 and peaking in 1985.

In our current situation, we have not even begun to raise rates, which suggests an even more powerful climb ahead for gold than we have seen thus far.