
Have all these problems that have gradually edged the average value of the VIX up for many months now, magically gone away? No, if you bother to check, they are actually getting worse, as I
have discussed in some of my recent articles. Are we in denial? Are we inebriated? Just what is our mental state? (click on images to enlarge)

As for substance and keen analytical insight, we tend to think of the fear index like we think of a manic-depressive teenager in love. But can the behavior of the VIX really signal anything about the forthcoming behavior of the market? Looking at a VIX vs SPX chart such as the one below from The Palantir Blog, one could surmise just that by simply paying attention to the slope of the VIX:

Even better than the stock market at foretelling recessions is the ECRI (Economic Cycles Research Institute) Weekly Lead Index, which looks at the economic cycle components that turn before the rest. This index has a remarkable record if you just look at the trends it makes:

The trend breaks come months before the stock market turns and the recessions. How do these trend changes compare with the above VIX trend changes? Since the VIX wasn't invented until 1993, we will just look at the last two great bear turns - 2000 and 2007:

The VIX changes in trend preempt even the ECRI changes in trend, suggesting an even better economic information discounting ability than one of the most respected economic predictors around.
Why do we typically see a collapse of the VIX below its long, slow uptrend just in front of the main collapse in a bear stock market as mentioned above? The only thing I can figure is a kind of fear fatigue where investors know there are serious problems developing for the market, but they are just tired of hearing about them. They maybe just start viewing it all as the wall of worry that seems to permeate markets most of the time. That justifies investing in bull markets, which climb the proverbial wall of worry, but it also seems to be a repeating pattern in approaching bear markets. We are seeing a repeat of the VIX reaction to the approach of the 2002 market collapse and the 2008 episode:

The upward sloping support line shows a gradually increasing unease with investors over a period of many months, then a massive VIX spike into the classic pennant formation. Then there follows a break of the pennant back down to the more gradual encroachment of fear. Here the market becomes tranquil, sentiment is rosy, and investors are tired of hearing "wolf". This Sounds a lot like the present.
But this appears to be the danger point when a turn back up in fear begins. In 2002 and 2008, there is one more fade of the VIX back to the support trend before the major stock collapse begins. We are at the first touch of the trend line now in the 2016 version of this pattern. There is certainly no guarantee of a repeat of the past, but markets do tend to move in repeating patterns controlled by human psychology. And the fear index is certainly one of the most psychological of them all.
James Picerno just published an article "US Financial System Risk Eases After Reaching a 4-Year High" summing up the current "stress test" the Fed regional banks publish. I want to focus on the one done at Cleveland:

He shows some of the other banks' indices in this article, which do not show as dire a run-up currently as this one. But if you examine those other graphs, you see that nearly all of the severe run-up they did in the last recession was well after the start of the recession, providing essentially no early warning. The Cleveland tabulation seems to be a little more excitable and ahead of the curve, even if it did give a false signal in 2011.
Picerno also recently posted "Macro-Markets Risk Index Signals New US Recession" where this markets based economic lead indicator shows its first recession signal since 2007:

Note this is also a lead indicator, shooting up over the 50% tipping point before the start of a recession. It gave a false signal in 1997, signaling only the stock crash, but no recession. However, it was not faked out in the 2011 troubles, not even going anywhere near the 10% mark.
And if you like trouble indexes that weren't faked out in 2011, consider another fear index besides the VIX. Credit Suisse has what they call the Credit Suisse Fear Barometer:

Despite all the PIIGS stress on the global financial system, this fear index remained unperturbed and, in fact, went down during this time. But as we go into 2016, this index has gone the opposite direction of the VIX. Note that, since mid 2014, this also seems to lead the VIX in fear spikes as in the October, 2014 market sell-off and the August, 2015 sell-off. Could it be front running the next sell-off ?
It is worth noting that the Fear Barometer is a much braver fear index than the VIX, having thumbed its nose at all the 2011 dangers and remaining more unruffled in the sell-off of last August. In fact, if you take a longer view of this index versus the VIX and compare for bravery, as in this piece from Phil'sStockWorld, you see this:
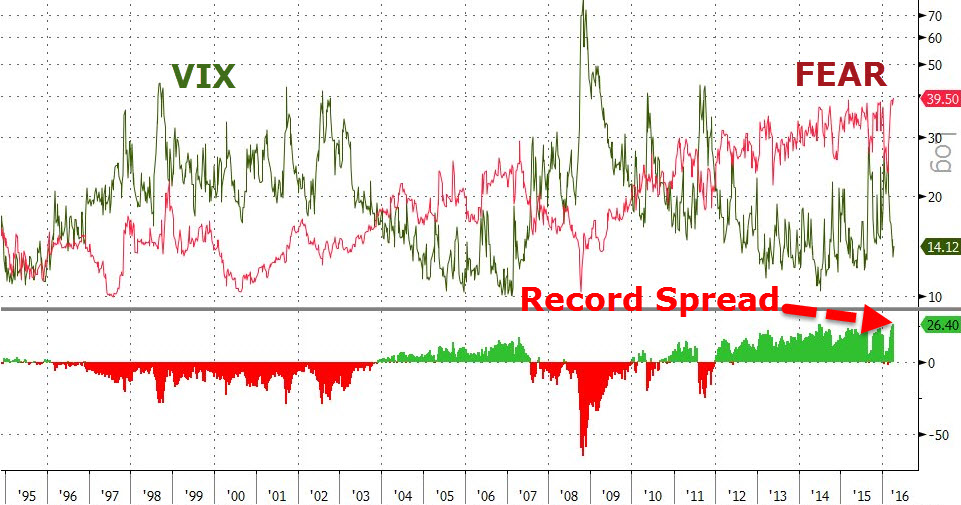
Not even the horrors of 2008 could run this fear index up. But now, it's more afraid than ever before. The above article, by Tyler Durden "Goldman Questions Rally, Fears Looming Event Risk Amid Record VIX Longs" explains two differences between the VIX and the CS index. The Fear Barometer measures the relative put/call volume whereas the VIX just measures total volume. And the Fear Barometer is geared to a 3 month outlook whereas the VIX is pummeled by every wind of rumor every minute.
Whether you go by the brave Fear Barometer or the slopes of the jumpy VIX, the market's fear gauges are registering danger in concert with the best economic cycling tools available (this does not include Fed Speak). Adjusting appropriate hedging screws in portfolios would be wise.


No comments:
Post a Comment