

Then, as now, gold was faithfully obeying the 140/200 ema moving average pair (red and blue lines) as support and the trend line shown as resistance. Then a break of this resistance occurred with a move to $524, a test of old resistance as support, and a huge new move into the next bull phase. As a weird coincidence from an entirely independent means of analysis, David Nichols' monthly fractal forecast is currently putting gold into a 64 day growth cycle into early October that he says will be the strongest yet in the entire bull market. That's 64 trading days (closer to 3 months calender). For those of us who simply like to study lines of support and resistance, it is also obvious that a change has occurred:

This chart is very similar to the 2005 chart above with the $524 swing point, but with the new $1764 swing point. It shows a pretty stable 3 year phase of gold's bull where a persistent line of resistance turns all the rallies into declines. There was a brief breach at the end of the strong 2009 four month cyclical move. The current breach is occurring at the beginning of this typical August to November strong period. This all implies a big bust of the 3 year channel.
I have outlined my disagreements with David Nichols' fractal analysis in other articles. My only problem back in 2010 was with his 64 month fractal or about a 5 year time limit on the high growth part of the overall bull market for gold, which he reckoned was to turn to bear market in February, 2011. I argued that this parabolic bull fractal pattern had other variations longer in duration that would go well beyond February, 2011, and that the current gold bull seemed to be an example of these. Well, February has come and gone, and I think it's safe to say there was no arrival of a bear market. But I can find little fault with Nichols' month-to-month range fractals - they have been stunningly accurate over the years. Jim Sinclair's call about $1764, David Nichols' call for the strongest 3 month move up yet, and the above simple support/resistance map all agree - gold is entering a new phase, and it ain't a bear market.
The cold calculating methods above also agree with a phase change in psychology that I believe has occurred over the last 3 years. This involves the basic question "What is money?" Well, it's that green and gray stuff passed around or it's electronic equivalent you may say. But is it? Is it really? That's what we used to think back in 2007. Is that what they're thinking over in Europe today? You can see this sea change in a 3 year chart covering the last two mega market crashes:
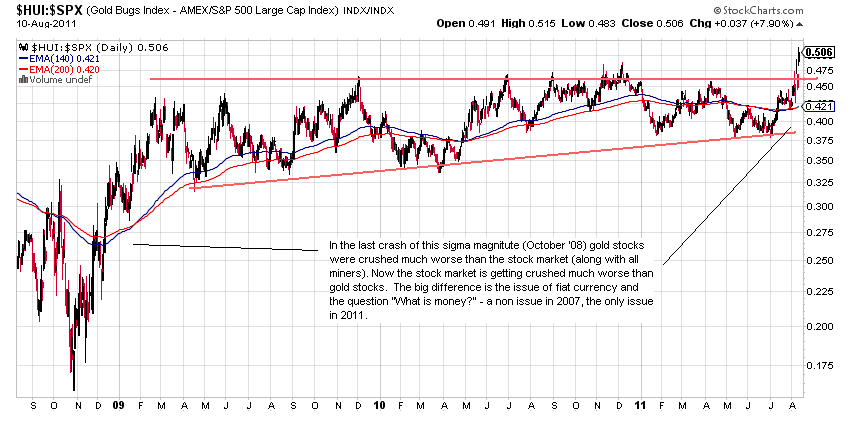
Here we have the gold stock index / S&P 500 ratio charted from mid 2008 to now. It drops when the gold stocks are under-performing the broad market and vice versa. As you can see, there is a vast difference between then and now. Why? There is a fundamental change in view going on as to what is money.
I have posted a discussion of this rapidly changing view with some interesting testimony by Ben Bernanke last month before Congress over at seekingalpha.com - just put my name in their search bar. The post is "Gold's New Phase And The Coming Revolution". It should be up in a day or two if it's not there yet.


No comments:
Post a Comment