
Let's look at what the charts telegraphed back then: (click to enlarge charts)

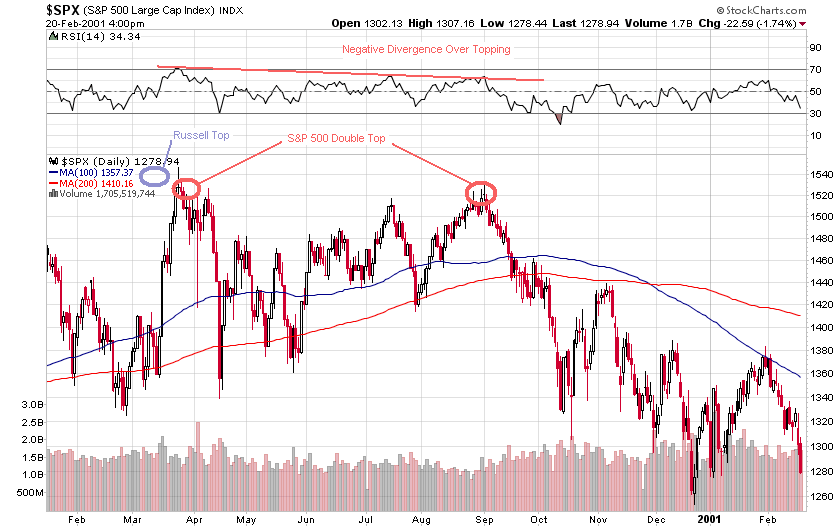
Here the Russell refused to return to the early March high as did the rest of the market:
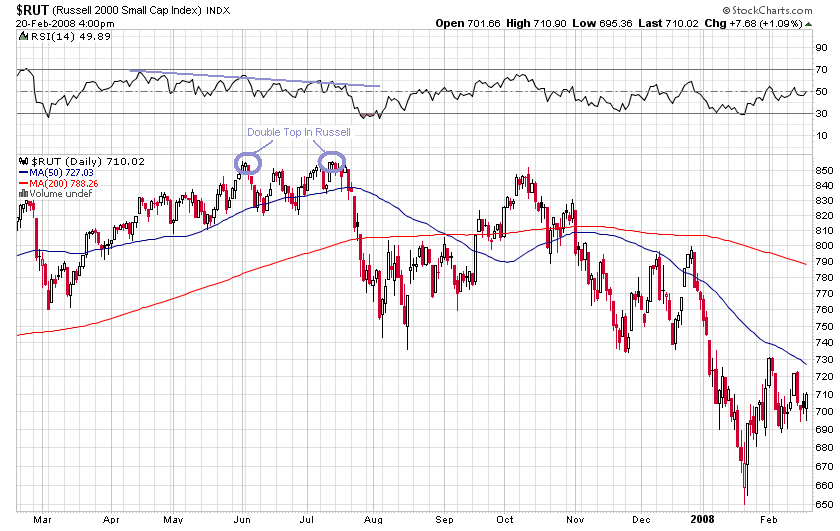
And in 2007, the Russell put in an early top, a double top this time:
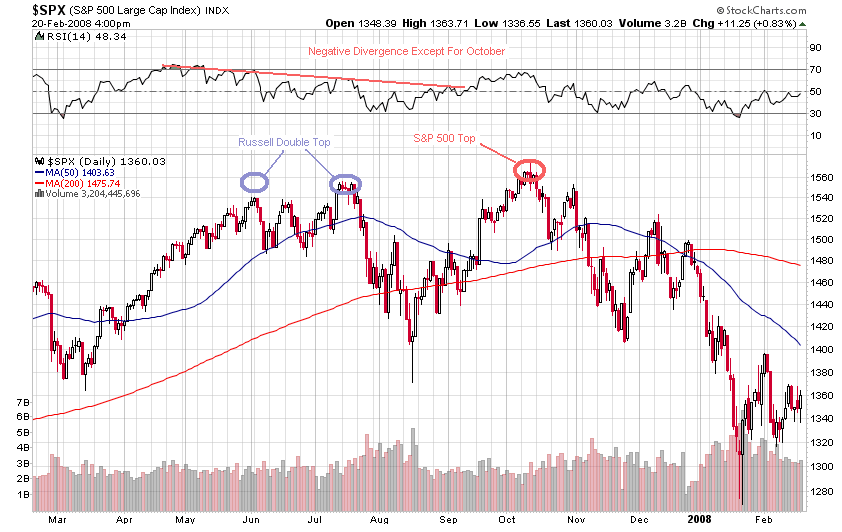
This was well ahead of the S&P 500 topping action:
What is the Russell doing now?
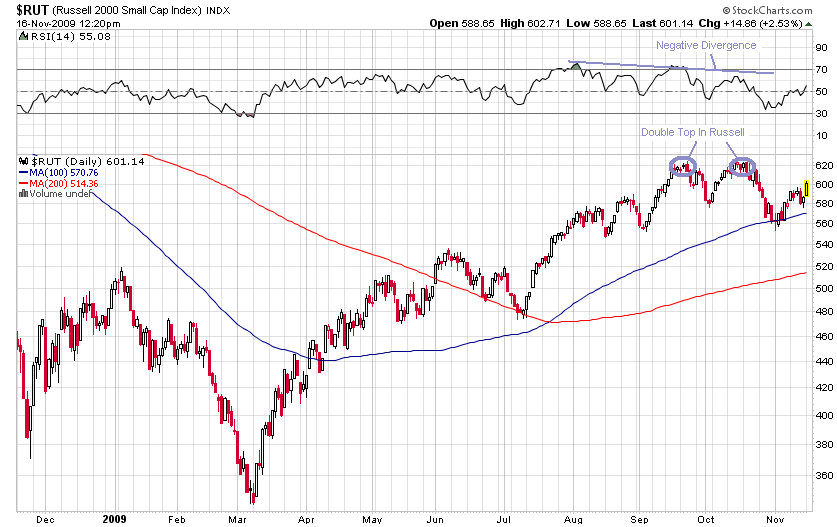
So the canary has keeled over again. This would lead one to be very suspicious of the new high being put in place by the other indexes:
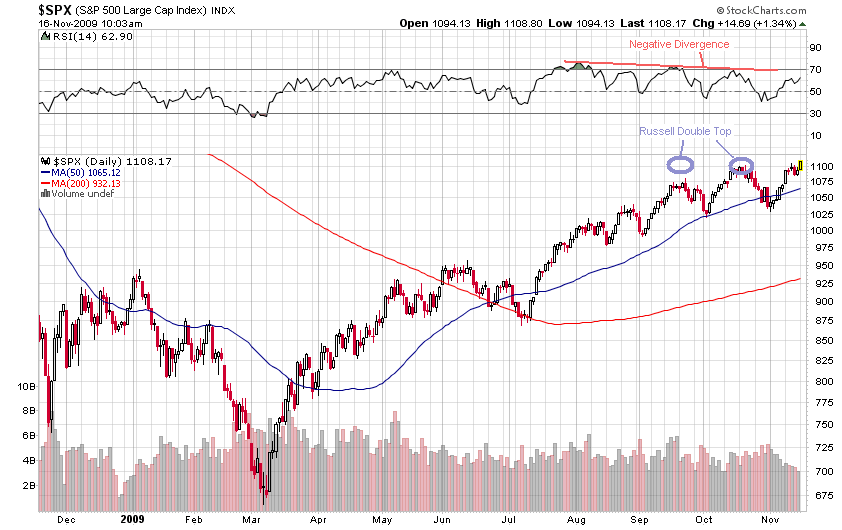
We again have the negative RSI divergence not to mention a sharp weakening of the volume on this latest run by the S&P 500.
However, the canary could turn out to be a false prophet of doom this time, predicting only a mild downtrend or consolidation if we continue to faithfully follow the key leader groups as has been the case all year - despite the technicals. The RLX large cap retail index is still very healthy as is the QQQQ large cap technology index - albeit this could now be just by virtue of them being large cap. The Baltic Dry Index has been tracing out the moves of the S&P about 3 months in advance this year, and it foreshadows about 4 months of a mild retracing, then back up again. So how much of a major turn the Russell is telegraphing now, if any, may be trumped by the market's dogged determination to follow these key leader groups. If all the leader groups, including the BDI, start to keel over, it may be time to get very defensive. If, for example, the BDI, now near a previous 52 week high, were to start to form a double top, that would be bad.


No comments:
Post a Comment