Sunday, May 23, 2010

Sugar - The Uncrowded Trade

If you like commodities over stocks, but are put off by the crowded and high profile nature of gold (as I am) take a look at the current condition of sugar. I began looking at sugar last July and found it was more explosive than most commodities, so to safely buy, it should be only after massacres down to the low end of its historic range. I wrote a post Sugar Price Explosion? back on August 8, when it was trading around 17. Since then, sugar did about a 35% climb over the next 5 months. Now it has come back down. So was that the explosion or is there more sugar bull to come? (click to enlarge charts)


The above chart (click to enlarge) shows the long-term history of sugar with its climbs in the vicinities of major recessions. It was just breaking out of its major trading channel when I posted this chart back on August 8. Since then (dashed line) it has done a repeat of the recession runs of the past, but is the bull market over now already? Jim Rogers doesn't think so. In fact, he favors sugar over gold.
"God knows how high the price of agriculture is going to go, so that's where I'm putting more of my money now than in other things...I think I am going to make more money in agriculture than I make in precious metals."
Rogers doesn't fret with small fry, short term volatility. His discipline on gold?
"If it goes down, I'll buy some more, and if it goes up, I'll buy some more. I periodically buy some gold. I don't have a method to it. I just buy it."
This brings to mind a saying of Louis Rukeyser - traders drive Chevies, investors drive Cadillacs. Rogers is mindful of basic, big view facts like China's middle class changing their diet and projected to grow by about 300 million the next five years. That's the entire population of the United States. And many other nations are going through the same changes. But short term crop fluctuations can send prices down in a hurry. Government estimates in Thailand, second biggest exporter of sugar, were projecting sugar to fall to around 14 cents back before the drop, but they didn't see it going much below 14, which is the production cost in Brazil, the largest producer. And in today's businessweek.com we have an article Sugar Slump May End On Restocking, Ethanol Demand where it's stated:
Sugar isn’t likely to trade below the “watermark” of 13 cents in the next three to five years, even as volatility increases, Fred Zeller, the managing director of sugar-beet growers group SZVG, said in an interview in New York. Sugar reached 13 cents on May 7, the lowest level since April 2009.

If you look at the SGG chart, the ETN that follows sugar, it may indeed be putting in a bottom near 14 cents (about 42 on the ETN):

There is a clear break of the 20 day ma which had been defining the decline. And it's doing this in the face of about every other commodity on earth getting hammered. Rogers sees not just a brief spike in sugar, but a huge multi-year rise. "I am certainly expecting sugar to go much higher during the course of the bull market over the next several years." (Money Morning, 8/25/09, Six Ways to Profit From Guru Jim Rogers' Prediction That Sugar is Sweeter Than Gold) If he is right, the run to 30 cents was just a foreshock and this is a dip worth buying.

Rogers doesn't think there is enough productive capacity among farmers to keep up with basic food demand growth. Inventories are at multi-decade lows. Any weather problems cause big price problems. And sugar, much more than any crop, competes with energy demand in the face of a declining conventional crude capacity. Brazil devotes fully 50% of their sugar crop to ethanol, another fast ramping demand growth story as the densely populated emerging world motorizes. So far, sugar ethanol is the only nonfossil auto fuel with anywhere near the same net energy as natural gas and oil. It's really the only thing that is effectively replacing gasoline and diesel on an energy balance basis - vastly more effective than deepwater drilling, tar sands, corn ethanol, biodiesel, or electric (considering that most electricity comes from burning mined coal). Sugar ethanol cuts greenhouse emissions far more than any available auto fuel, and it already commands 60% of the global ethanol market. If you look at a graph of where all the people are that produce sugar but don't use much fuel versus where all the gas guzzling people live who don't farm, you see something interesting:


This bubble chart was produced by Stuart Staniford of theoildrum.com, and with sugarcane ethanol the best crude replacement, it has possible peak oil implications. The big sugar producers are the big blue blobs of population who use little energy for themselves and are at one end of the inverse curve. The big users of energy, who only know how to put sugar in their coffee, are grouped at the other end. One can envision a happy export situation for all concerned developing in the future.

Yet you don't hear much about sugar. It was briefly popular with the funds last year as it rose to a 28 year high, but they have dumped it this year with a surprise crop surge. It is remarkably uncrowded right now. If the threat of fund darlings hitting a bout of forced redemption selling in market turbulence gives you the Willies, sugar is about as far from a darling now as it gets. The Agri run of 2007 has gone cold. Was that the first shock of a food shortage earthquake? When asked for his best investment advice these days, Jim Rogers says, "Become a farmer".

Tuesday, May 18, 2010

Is China Ending The Global Rally ?

The Shanghai Index is doing a frightening crash if you haven't noticed - down some 21% from its high last year. It has dived way below its 140 day ema, a good divider of bull and bear markets.
China has taken measures to cool down it's economy and make it a sustainable growth, but isn't this a good problem to have? Why is their market acting as if a huge, unavoidable recession is beginning when they've just tapped the brakes on a really good economy?

The China dive is probably one and the same with the euro dive. China lives and dies by its exports, and guess who is China's biggest trading partner. It's Europe. If you compare the charts of the euro and the Shanghai, you see that the decline in the euro began in December and soon began overwhelming China's stocks: (click to enlarge)


China stocks seem more worried about the European consumer than their own consumers. The market is vexed about this and not actual planned economic activity. You can see this by taking a look at China's version of the Dow Theory with the Baltic Dry index for shipping being their transports:

Th Baltic, like the Shanghai, is a leading index doing things at least a couple months ahead of the S&P 500. It put in a bottom in December ahead of the March '09 bottom. It did a big pullback in March ahead of the big July pullback. And it did another big pullback ending in October ahead of the one that ended in late January. So now the Shanghai is falling off a cliff. Egad, is this what's next for us? But the Baltic, in Dow Theory fashion, is not confirming this move by the Shanghai. Both have been tracing out a big cup and handle bottom pattern, but the Baltic doesn't speculate and is immune to the stock market's speculation. The BDI seems to be going through the typical cup and handle major cycle bottom with a break of the handle to the upside next. And it should be kept in mind that this index is now understating the bull case because of the over-build of ships coming online from the roaring commodities business of about 3 years ago (3 year build/lag time) otherwise, the handle may not have been as drawn out as it is.

In addition to China's tendency to follow the euro, this market could just be completing the common correction maneuver whereby the fundamentalists are ejected from the bull's back with something like the euro and the technicians are kicked off by a brief breakage of a widely followed TA condition. A large consolidation triangle in the Shanghai has been broken to the downside busting below the recent lows from the last correction. Markets are really dastardly that way. You can see an article on this over at safehaven. A similar thing happened back in the July correction bottom when everyone was horrified by the breakdown of the apparent head and shoulders top in the S&P.

Of all the key leader groups for the broad market, the Shanghai is the only one doing a technical breakdown, and this could be mainly a currency gyration, not the best thing to base stock cycles on. And the move it is making is not being confirmed by the Baltic. If you look at the technology leader group, you have a moving average condition typical of an ongoing bull market:

You don't see the breakdown below the 140 ema but a correction to this critical curve that looks to be bouncing around a bottom as it did in July and February, only with better A/D strength and a stronger economic recovery going. The 200/140 ma divergence shows no sign of breakdown in the RUT, RLX and other groups that have been leading since the middle of last year.

Sentiment is really sour right now as at all market bottoms. If you sample the comments at Seeking Alpha, they are as rabidly bearish as at about any bottom. And the CNBC opinions are at the extreme other end of the spectrum from the unbridled optimism before the correction. Just days before the correction began, Jim Cramer was crowing about the clear expressway to Dow 12000 and making fun of the "nattering nabobs of negativity". Now he's bitching about the "building skepticism". And an article I saw at safehaven shows that the big fund managers are at a max point of distribution and you dare not go against them. But wait a minute. Aren't these the same fund managers of whom over 70% don't outperform the S&P 500? Why would you want to do what they're doing? They were at about this same stage of distribution at the Feb 4 bottom.

Until more leader groups do a technical breakdown (and they may) you probably have to give the devious bull the benefit of the doubt.

Wednesday, May 12, 2010

Gold In An Open Field ?

Ignoring the seismic shift in the sentiment and fundamental view of gold wrought by the recent euro mess for a minute, let's look at just the technical juncture gold finds itself at.

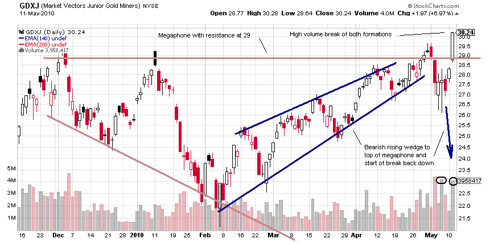
By conventional technicals, you have the small gold stocks, which typically are the best barometer of major trend changes, doing a fairly important formation break this week: (click to enlarge)

Megaphone formations typically break energetically when they break, and the four month correction in gold from December has put the small miners in a megaphone. Another overall market correction, as in January, was looking to run the mining stocks back down into the gyrating middle of the formation, but the strong move now underway may bust both the rising wedge within the megaphone and the megaphone's resistance level at the top. The volume would certainly indicate this.

By unconventional technicals (fractal analysis) you have gold now emerging from a four month corrective cycle (gold does everything in four and eight month stretches) and is nearing the end of a 64 month cycle. And the energy levels involved in fractal study have gold beating the last tackler just now. As David Nichols, chief diviner of gold's fractals said in his May 7 report:

The important thing to know right now is gold is now in the final 8 months of this pattern, and this is when amazing strength should start to show, as the global flow of speculative capital pours into the pattern.

There is almost nothing left now to keep gold from breaking into the clear. $1,192 and $1,210 are the last important energy levels prior to lift-off.

Sunday, May 9, 2010

A Technical Point On This Correction

All eyes will be on how and where the markets will rebound over the next few days and weeks. One critical thing to keep an eye on is the relative performance between the big and the small, the S&P 500 and the Russell 2000. The small are more volatile and normally decline more vigorously in a bull market correction and climb back faster to new highs. But the small also seem to pick up on major trend changes a little sooner than the big. So the small began misbehaving in mid 2007 before the Dow and the whole market went sour. If you look at what the Russell did over that time relative to the S&P coming out of the late July correction, you see that the small stocks were tardy about climbing off the correction's bottom. First, let's look at the big: (click to enlarge)

Now, let's look at the small:

The same thing happened as we entered the 2001 bear market There, we had a March/April correction (top for tech) in 2000. First, look at the big stocks:

Now compare with the small stock behavior:

The small stock averages seem to know something the big stock averages don't. Small companies are generally more sensitive to major economic turns, and discount such information better (if you're an efficient market theorist as I am).

So one primary thing I'll be watching coming out of our present correction is how the Russell bounces back compared to the Dow and S&P. If the Russell leads, staying mostly above its 140 ema, the bull climb is probably still on. If the Russell seriously lags, it's a rally you may want to sell into.

Saturday, May 1, 2010

Where Is Gold On The Bubble Map ?

Gold had a good week, so now the gold bulls must endure a new round "bubble" cries from the gold bears. Anything that has a good week, month, or year must endure this. In the short term, they could be right. But to say that something like the current gold bull market is a historic bubble at the bursting point requires more analysis than short-term overbought technicals or an uneasy feeling that it's gone too far too fast and is too crowded. Why not just filter out the short-term noise and compare it side-by-side to the other historic bubbles? If you do this simple exercise with perhaps the three most well known historic bubbles of the modern age, you see this: (click to view)

Long-term bull markets usually end in a parabolic rise. So this chart basically divides these bull markets into the relatively flat 8 to 12 year pre-parabolic phase and the 2 to 6 year parabolic rise. As the chart clearly shows, the current gold market is nowhere near the end phase of a historic bubble. In fact, it looks to be just now be getting cranked up for that.

I left off from the chart some comparisons that may not apply. For instance, oil up to $147 in 2008 is sometimes referred to as a historic bull/bust cycle. But the credit/great recession gyrations in oil and most commodities, including gold, may wind up being just a severe, but brief interruption of these bull markets. The three charted are historic bulls that have been certified dead for years. I don't think we can declare oil dead just yet.

Now it's true that some respectable investors have described the current gold market with the word "bubble", including the Chinese officials in charge of diversifying China's bank holdings and George Soros, who commented at the recent World Economic Forum in Davos that gold was "the ultimate bubble". But China has to be suspected of talking down the price of gold so they can add more. And George Soros was talking about gold as being the end result of a chain of bubbles when he said it was the ultimate bubble. The bubbles of 2000, loose money, housing, more loose money, etc. ultimately lay the bubble forces at gold's door. So if gold is to be the ultimate historic bubble, it has a long way to go from here.