Wednesday, October 20, 2010

China's Drag On The Market

I keep hearing and reading about how the market's outlook would be so much better without those darn Chinese. Yesterday you read that China sparked a sell off with their raise of interest rates. I've heard that the Chinese economy can't do well without the US consumer doing well, and we all know the US consumer of yester-year isn't coming back soon. As China goes, so goes the world, and the Shanghai has been in a sustained downtrend for over a year, being far in the red YTD. Well, take a peek at what's happening now.


William O'Neil, founder of IBD and a pretty sharp technical analyst, would look at this chart and have a cup and handle bottom reach off the screen and slap him. The handle is a little too long, but it's breaking, which would suggest that China's market is resuming a climb . China is moving to prevent bubbles. They are not stupid like our US leadership, so, yes, they are raising rates. And they are distancing themselves from not only US fiscal policy, but the US consumer as well, becoming a trading partner to the world.

Their stock market has spent most of this year below the critical 140 day ema (blue line) but has now regained the territory above it and turned its slope back to positive. China does indeed tend to be a harbinger for the rest of the world. Note that the bear decline for the Shanghai ended in October 2008. So the cup and handle breakage would predict a continued climb for global stocks. Other harbingers, like the QQQQ and the US transports are well above their April highs and point in the same direction for the broad market. China a drag on the market? Well, maybe not right now.

Sunday, October 17, 2010

Gaming The Next Gold Correction

Gold has had a good run lately, and that begs the question, "When is the next correction and should I try to sell and buy back around it?" It's pretty easy to know when a correction is nearing. If you believe in the fractal voodoo, a one month correction is due to start around the end of October. It is of the type after a 64 day cycle that occurred in July this year, not the big four month type that started last December. So why not be clever and dance around it?

Well, if you had been clever enough to dance adroitly around the last two corrections, both the big one and the small one, this is how you would have done in all that tracks the price of gold (click on charts to enlarge):


It would have been worthwhile, putting you 7.7% and 5.5% ahead of a continuous hold. But when you try to apply this cleverness to individual gold stocks, this is the very typical result:


The cleverness backfires and instead of you gaming the corrections, Mister Market games you. And that's if you had timed both corrections to near perfection. In real life, that ain't likely. This doesn't happen with every stock, but it is the very typical case with the very small stocks (LODE, TRE, GBG, GRZ are some other examples). This is because the small miners have their stocks moved much more by their own individual property stories than by the short term fluctuations in the price of gold. It is a much bigger deal to them if a property is making good strides ahead than if gold goes $100 higher or lower. The big mature miners with a huge portfolio of producing properties see their stocks move much more in unison with the price of gold and silver. Trying to game corrections makes much more sense with them. But with the smaller miners, it becomes much more a roll of the dice.

As for a portfolio management strategy for gold corrections, it may make sense to raise cash with the gold and silver ETFs and large miners if you're attempting to trade as opposed to indiscriminate selling. When you are holding a quality junior miner, you are holding a development story that will jump the price of the stock at the most inconvenient of times for you as a trader.

Monday, October 11, 2010

Maybe The Best Gold Stock You Never Heard Of

I've always held a deep respect for the thorough discounting efficiency of the stock market. In fact, my main analysis method depends heavily on it. So I tend to sneer at the "undiscovered gem" approach - "Oh, the market has discovered it, fool, and it knows more about it than you do" is my reaction. So, it is with a sense of uneasiness that I present to you an undiscovered gem.

Sante Fe Gold SFEG seems to be such a gem. It most certainly is undiscovered. Even amongst the small juniors, it is about the most unheard of, stealth gold stock priced above $1 I have ever run across. About the only people grabbing at it are the insiders, and they really like it. At an IH (insider held) factor of 35%, it is the 3rd most heavily insider held gold stock I have found (behind GORO and BVN) among the 60 or so I track that trade on US exchanges. And it's all officers who own, not funds or other companies, and some of the heavy handed buying has been just in the last year or so.

About the only hoopla one finds is some write-ups at investor village wherein they explain:

And how did all this come to be? Essentially it has been borne out of an extremely conservative management style intent upon under-promising and over-delivering, that with little fanfare has been quietly and methodically acquiring additional properties at every opportunity, that not only hold great value already, they also hold additional superb upside discovery potential and at the same time sought to downplay expectations with initial extremely conservative projections based on $650 - $850 Gold prices along with conservative output projections and the prospect of better than expected grades, that might actually have a much better than expected impact, not only on the initial Gold and Silver output projections, but also on the bottom line due to what might be larger cost savings, along with a multiple increase in production, that has basically set the stage for an unexpectedly large increase in revenues, that a short time ago, did not even seem remotely possible even to us: And so now it appears as if the impending prospects of all this has certainly vindicated our judgment and decision to select SFEG as our preferred means of investing in Gold and Silver, with perhaps among the most upside leverage and potential for the coming year and early in this decade as we attempt explain further and offer some background as to how we came to this decision quite some time ago.
And because we've had experience of this before, when we were able to identify extremely undervalued positions in both mining and other issues that were able to gain exponentially from similar, albeit much lower multiplier effects that still turned out to be very successful investments. With our track record of identifying ahead of time and capturing much of half a dozen up to 100 fold mega-winners this past decade We honestly have not seen a better, clearer or more easy to project so well ahead of time situation than Santa Fe Gold and re-iterate: Very few times in life are you ever likely to be faced with the prospect of being able to gain from a multiplier effect that you can see so clearly ahead of you especially any financial or investment multiplier because as you continue to evaluate Santa Fe's prospects
The average cash cost of production in the industry is about $580/oz for gold. I've seen figures of around $250 and $300-$400 projected for Sante Fe. It's been tabulated that M&A pricing metrics, as shown by the recent Andean Resources buyout, puts SFEG's current $1 stock at $36 by the same reserve oz valuation.

In support of all this, 26 institutions considered Santa Fe to be a compelling enough investment proposition at $1.30 per share earlier this year and SFEG reached a high of $1.74. Therefore, since the fundamentals of the company are already substantially better today than they were then, with increasingly strong revenue growth forthcoming, Santa Fe would appear to be a rare and uncommonly undervalued and opportunistic anomaly in the current marketplace, in particular when compared with its peers.
And with an additional 65 institutions or so that have either met with management personally, or by phone conferences and are now monitoring Santa Fe in expectation of an AMEX listing before too long, as Santa Fe continues to execute and potentially over-deliver, a real buying stampede in this issue could ensue, especially as important resistance numbers are taken out on the upside and most importantly, once new 52 week highs are reached and beyond new all time highs. And in addition to all of this, the company has already stockpiled more than a year's worth of production, presumably with all the intent to compress more than two years production into one and ultimately, ramp up in multiples of 400 tons per day sooner than anticipated, thus affording them a head start towards increasing to 1,000 tpd plus and very significant revenue growth.


Sometimes it takes the marketplace time to factor in all of the information at hand and much of what is written above may not yet have been assimilated by all investors, but a few are beginning to get the memo and increasing numbers could begin to realize just how truly undervalued Santa Fe really is that at some point could create a rush on the stock and a bottleneck situation where demand for stock would overwhelm supply

I've read a lot of complaining about the company's public relations efforts (or lack thereof). But they may be trying to fix this starting with an investor conference call this Friday. All of Sante Fe's operations are in the Southwest US and do not involve any geopolitical problems (unless Obama nationalizes the mining industry). Technically, the stock looks pretty interesting:


It has made much higher levels since mid '08, which is more than you can say for almost all the miners - a nice sustained uptrend that correlates well with the gold moves. It looks to be organizing for another sling shot move up with the current gold move:

Tuesday, October 5, 2010

The Next Megatrend

I have found that investing is most easily done by identifying megatrends and working mostly within that area of the market with individual stock analysis. Studies have found that half of a stock's movement is a function of what its sector is doing. So if you're right about the major sector trends, you take positions in the best stocks and let them ride and trade only for very good reasons - "be right and sit tight" as the saying goes.

Gold is the megatrend right now. But all megatrends end. So what's after gold? If you're an investor who attempts to correctly switch horses when they die, you need to be thinking ahead and preparing to mount the next horse when the one you're charging ahead on is shot out from under you.

Before we consider what could possibly emerge as a megatrend after gold, let's first think about the shooting of the gold horse. I suppose the first thing that comes to mind when thinking about the end of something as hot as gold is your classic blowoff top followed by a catastrophic collapse that goes on for many years. This is what is thought of as coming after a parabolic rise. Isn't that what the Nasdaq of the 90s did and gold in 1980? Well, I would direct your attention to my previous article "The 64 Month Bull Market Fractal" to point out that the parabolas sometimes end that way, but can end with a jarring disconnect from the parabola followed by continued high range pricing and new highs - just without the nice smooth parabola. There is a current article over at Kitco by Chris Blasi suggesting that the macro economic conditions are so different now from 1980 that it almost dictates a different outcome in this gold bull market:

Not a 70's gold bull replay.

True, gold's last bull run gave way to 20 years of price erosion, ratcheting down to the lowly exchange rate of $255 per ounce. Regardless, the US and global economic landscape of 2010 is vastly different than that of 1980. Today's exponential growth of sovereign debt is straining confidence in faith based currencies, particularly one which holds the mantle of world's reserve currency. This current debt differentiator, in conjunction with a myriad of other issues inhibiting US economic growth, is substantial enough to reasonably assure investors of a strikingly different course and conclusion to this gold bull.

Take a look at the US debt chart in this article and visibly compare 1980 to now - a vastly different condition as to its rapid healing prospects. So the shooting of our gold horse may actually be more of a moderate hobbling - but something to avoid nonetheless.

So what about a new megatrend to watch for? How about oil? When oil was passing $80 a barrel two years ago, it was about the only game in town and funds were loading the boat with it. All the oil bears were crying "speculative bubble", and when the financial collapse came in '08, it was just that - everything was a collapsing bubble then. Now oil is passing $80 a barrel again, and oil and the energy stocks are underperforming just about everything. They are the dog of the day now. You certainly can't blame the pricing on a frothy frenzy this time.

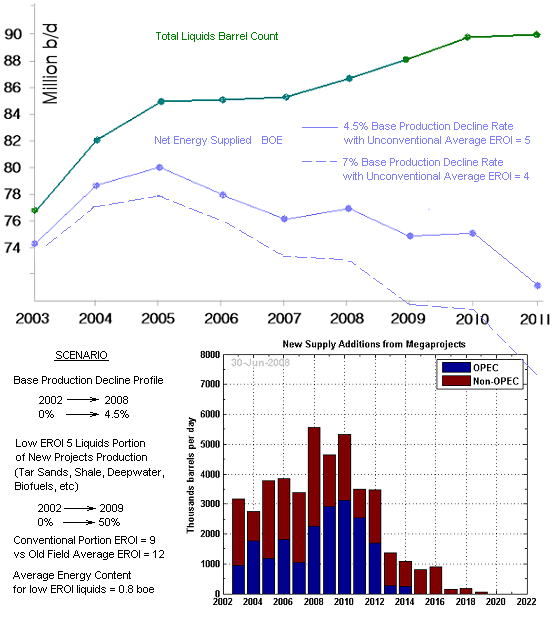
I think the price of oil may surprise and confound what I call "the barrel counters" - the energy planners who by and large are blind to the net energy crisis brewing in the world. They don't understand the profound decline in net usable energy coming from the industry. If you tabulate a real net usable energy curve, which used to be about one and the same with the raw barrel count, you get this disturbing picture (click to enlarge):


A sharp divergence between net energy and official barrel count began to emerge in 2005 - about the time the price of oil started going crazy. The Great Recession has perhaps camouflaged the real usable energy supply shortage since 2008. But now we have a recovering global economy matched against a steepening divergence between usable energy and barrel count - a double whammy that could bring three digit pricing back before we think. Crude alternatives are stepping in to fill the gap, but probably not fast enough. Oil has been a dog. But I have a hunch this dog will have his day.

Tuesday, September 28, 2010

The 64 Month Bull Market Fractal

I don't know how familiar you may be with the emerging science of fractal market analysis, but there is an element of it that has a direct bearing on gold right now. To briefly overview fractals, they have found that stocks and indexes have a strong tendency to move in repeating chart patterns at various scales (self-similar, they call it). So a stock may consistently produce say a 2 year pattern which is also evident at a 2 month time frame. Sounds silly, I know. The theory is that there are well known fractal growth patterns in nature, crystals growing under a microscope and about any basic growth in nature; and these are abundant with self-similar, geometric, repeating patterns. They've known about these nature patterns for many decades, but only recently has anyone thought that financial markets may grow by these fractal patterns too. When they investigated, they found that the unchanging human nature did indeed infuse fractals into the trading charts.

David Nichols, a pioneer in this investigation, finds that there is a 64 month parabolic fractal signature that seems to show up at about every major bull market. The duration varies a couple months or so, but the pattern is a "sprouting" of a parabola, a bullish change in previously sleepy trading, followed by parabolic growth into a violent top about 64 months later. As an example, he points to Toll Brothers as a proxy for the housing bubble (click to enlarge charts):


The months are marked 1 through 65 for the parabolic progression. The Japanese Nikkei bubble of the '80s did the same thing:


I won't flood this piece with the other charts, but the same thing shows up in the Dow of the 1920s, the Nasdaq of the 1990s, and other bull markets. It also shows up in the more notable bull crazes of individual stocks. For example, Intuitive Surgical ISRG was such a craze:


Here the "sprout" of the parabola was a subtle change in trend from sideways or down to up.

Then there was Hansen Natural HANS, remember that hot potato?


Like the Nasdaq chart, the gain was so dramatic, you have to magnify the start point area to see the "sprout" point:


So what does all this have to do with gold today?


Nichols reckons the change in behavior "sprout" point as September 2005, although gold was already in an uptrend by then, but a very weak one. Since this chart was done, we have pretty much been following the fractal.

The end of this gold parabola is early 2011. This brings up some difficult questions. If the gold bull market is to end in 5 months, does that mean the entire commodities bull also dies in 5 months? It's hard to imagine a commodities bull without gold being a part of it. Do all the world's debt and currency problems go away in the next 5 months? That would be nice, but I somehow doubt that will happen. The hard assets/paper assets cycle runs about 12 to 18 years; our present commodity cycle is barely 9 years old with much more paper difficulty lying ahead:


So how can it be that the 64 month gold fractal is happening now, ending in 2011 and disrupting the cycle?

I'm not a fractal expert, but it strikes me that the parabola is just a part of a bull market, and it can occur either in the middle or at the end. In the case of the Nasdaq and the Nikkei, it occurred at the end. In another case that Nichols points out, the recent oil bubble, you have to seriously doubt that the bull market is over. There definitely was the parabola:


The parabola is clearly history. Does this mean that oil will never be over $100 again? It has already gone back to over $80 during a recession and its aftermath. At some point in a recovering global economy, demand will begin outpacing supply as it was starting to do 4 years ago.

If you examine the Intuitive Surgical and Hansen Natural charts above, you see that once the parabola phase was over, pricing remained high - even making new highs. I suspect that this will be the case with both gold and oil.

Sunday, September 19, 2010

Cancel Breakout Alert

Continental Minerals is being acquired by Jinchuan Group it was announced Friday. There shouldn't be much more rise in the stock as it is near the present buyout price (I hadn't seen the announcement yet on Friday when I did the previous post). An agreement has been signed, it looks like a done deal.

Wednesday, September 15, 2010

Breakout Alert

Continental Minerals (KMKCF) is a junior Canadian gold/copper/silver miner that mines in China. From what I read, they have a promising property there with well over 4 million oz. of gold and 11 million oz. of silver. The stock seems to be doing a promising breakout (click to enlarge):


Since the big gold rally late last year, in which KMKCF participated nicely, the stock has been idling in a megaphone formation. After a false breakout in April to about $2.50, it may have completed this formation today with a real breakout with some building volume. I like the moving average geometry and the heavy 24% insider interest. If it doesn't do a breakout now, it probably will soon if gold keeps working its way higher.