Thursday, April 22, 2010

Beyond The Barrel - And Over The Cliff ?

Tonight, CNBC premiers "Beyond the Barrel - the Race to Fuel the Future". This is a look at the alternatives to the crude oil bursting forth from the ground that has spoiled us for decades with cheap, abundant energy. One thing that will probably be missing in the discussion is the major issue EROEI. What is EROEI? How do you pronounce it? Well, I don't concern myself with pronouncing it, but I do get vexed by how much attention is being paid to it.

EROEI is simply Energy Returned On Energy Invested. It was not even a word back when Jed Clampett could start a bubblin' crude when he was out shootin' for some food. But as we started drilling deeper to recover oil, people like Cleveland and Hall began tabulating estimates on how much of our energy supply was being used to find, drill, and use our new energy finds. They come up with about a 100 figure for oil of the 1930s (1 barrel of oil burned to get 100 new barrels online). This had dropped to around 30 by the 1970s as so much of the easy to find oil in the world's elephant fields in naturally pressurized reservoirs has already been exploited. EROEI for oil and natural gas now is running around 8 - 11 depending on locale.

That is a huge drop from the 100 EROEI of the 1930s, but as it turns out in the math of net energy, it's not that big a deal. What is a big deal is what happens as this EROEI number goes from around 8 to below 4. (click on chart to view charts)

This chart, constructed by Dr. Euan Mearns, an editor at theoilddrum.com, plots net energy as a percent from 100 down to zero over EROEI's range from very high down to one, where it is taking a barrel of recovered energy to obtain a barrel of new energy (no net energy to use). As you can see, we're in fine shape as long as EROEI keeps north of 8, but we fall and we can't get up as we go over the cliff as EROEI goes to 4 and below. This is an exponentially increasing problem as we try to replace peaking crude production with things like corn ethanol, which is a worthless solution. As this oil replacement scale shows
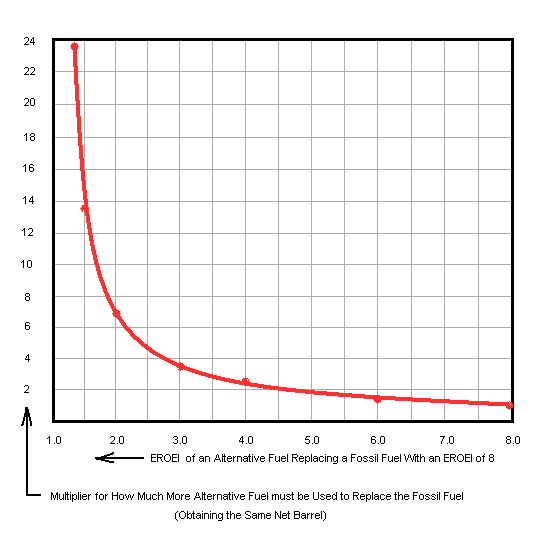
corn ethanol, at an estimated EROEI of 1.3, must be produced at a rate of over 20 barrels for each barrel of oil it replaces energy-wise! Many biodiesel, solar, and electric EROEI estimates aren't much better.

You see a lot of barrel count estimates of future oil production as we deal with peak oil, but as we go over the top of the conventional oil production peak (the evidence suggests we already have) the flood of "alternative" liquids such as tar sand oil, deepwater, etc. are severely challenged to come close to matching crude's EROEI. This makes a big difference in how much net energy is actually being delivered to society despite the raw barrel count. This makes a good EROEI estimate of any new alternative fuel critically important - its most important feature. But nobody is paying any attention as we approach the net energy cliff.

If you were to do an adjusted production curve to get an estimate of a "net energy curve" based on best current estimates on EROEI of the various nonconventional oil liquids going into the barrel count of official oil supply, you get a much different curve than the official projections (which all our energy planning is based on)
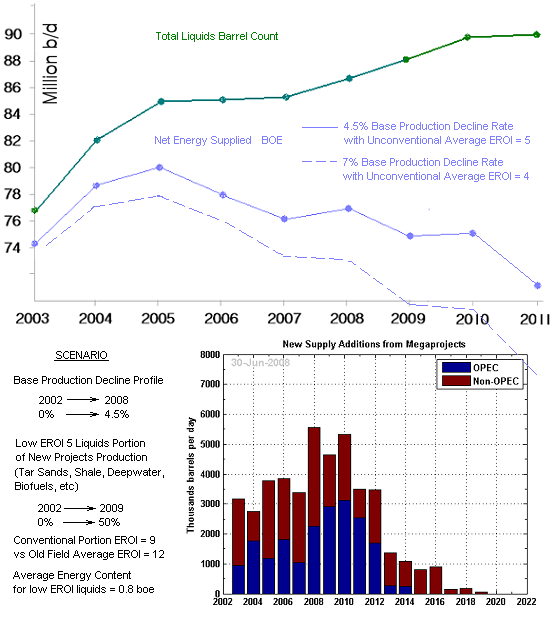
The two curves are for the more traditional base production decline rate estimate of 4.5% annually and for the newer estimates suggesting this to be around 7% - so a kind of best and worst case range is shown. The EROEI issue becomes acute as we go past about 2011 unless something radical is done about the low EROEI oil replacement theme that is now so entrenched in Congress, which seems dedicated to any alternative energy in direct inverse relation to its usefulness in actually replacing oil. They dote on corn ethanol because of a powerful corn lobby. They slight lightly lobbied natural gas in favor of the black lung clean coal coalition. They reward anything that will take decades to scale up as an oil replacement and ignore the one viable thing that's already at the scale and the EROEI needed - natural gas.

Obviously, replacing oil is going to have to be a team effort from many things - renewable ethanols, solar, wind, and the best currently available bridge to all those future fuels - natural gas. But we're going to have to pay a lot more attention to the EROEI science of all these team members, or we're not even going to make the playoffs.

Thursday, April 15, 2010

MFRI At Possible Buy Point

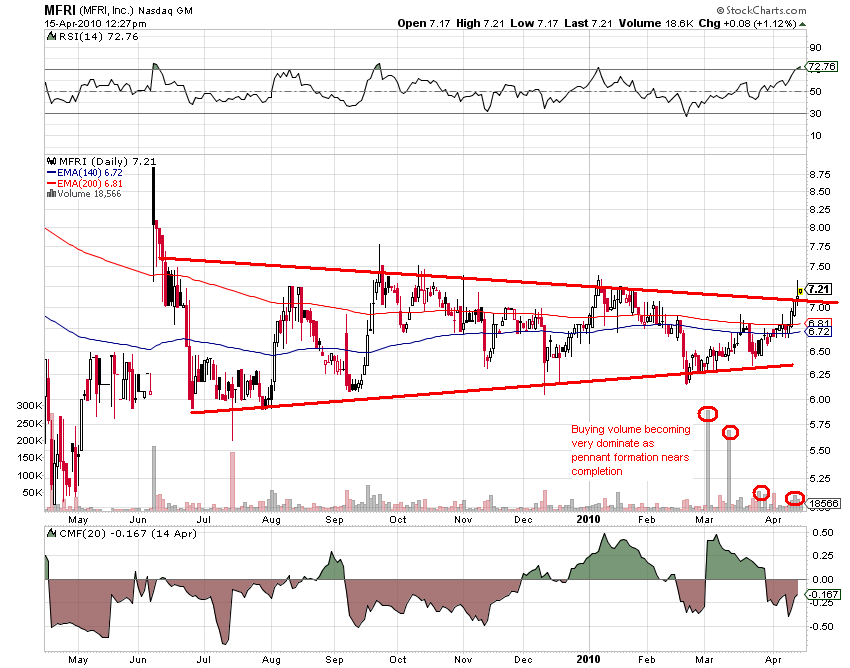
MFRI Inc. makes and designs piping systems globally. This is a deep cyclical that hasn't deep cycled yet - at least not the up part of the cycle.

The cash flow and earnings per share certainly look to be catching the recovery, but the stock has been left in its pristine, freshly annihilated condition. Now you can have it at a price / cash flow of a silly 1.5 and at a PE of 5. The history of the stock price has been a stronger correlation with earnings than cash flow, but by either consideration, the stock looks cheap. Technically, it looks to be breaking out: (click to enlarge)

A negative is the RSI parked at an overbought 70, and the A/D isn't very impressive, but a powerful breakout move could keep the RSI between 50 and 70 or over for awhile.

Sunday, April 11, 2010

Kimber Resources At Technical Break Point

Kimber Resources (KBX) is a Canada based gold and silver junior miner with developing property in Mexico. It has no monetary fundamentals yet, so technical analysis becomes more important - and Kimber is a chart reader's delight (click to enlarge)

As with so many gold stocks (and technology stocks) the refusal to follow the herd down into the end of the world stampede in March '09 was a dead give away to their imminent and vast outperformance. Just looking at this chart, you had no hint that the market was doing anything in February and March. This quiet base broke violently as gold's climb from July progressed - then the gold correction. A prolonged bull flag pattern ensued with big buying volume and a nice accumulation bias. This flag correction appears to be ending with some nice upside being suggested.

Friday, April 2, 2010

Squeeze Time For Gold

Gold's four month correction, a patience testing ordeal for the gold bulls, is now at a pivotal point as I illustrated in my post of a few days back. This is deduced from conventional technical analysis, but what about the fractal analysis that has been calling gold's major turns like a square dance? (click to enlarge)


If one were to note the major technical features of gold now, you would draw a major resistance level at $1130 and a secondary resistance at $1145. A big inverse head and shoulders bottom to the correction also presents itself complete with a candlestick reversal at the head. The 140 ema and 200 ema are shown; the 140 is a good divider of bull and bear markets. If you see anything take up residence below its 140 for more than a couple of months - well that's not so good and its time to rethink its bull market. Gold has been bouncing off of a very smooth, rising 140 since last July, when the current climb began, and it bounced again Feb. 4 and last week without any distortion of these moving averages - like a small rubber ball bouncing off a massive brick wall. So it looks like a major up move coming by conventional technical analysis.

Well, the fractal analysis says the same thing! Back on Feb. 23, David Nichols, a leading fractal gold analyst, had this to say:

"I have been expecting gold to struggle to get through the significant $1,128 energy level, and sure enough, it’s struggling. But it is following a typically bullish path that indicates the breakthrough should arrive shortly. I often discuss how it takes 3 or 4 attempts to get through a big energy level like $1,128, which is why I mentioned this ahead of time as being likely at $1,128, as this is such a prevalent pattern in market fractal patterns."

If you look at where Feb 23 was on the resistance level in the above chart, you see that it was about in the middle, so he was right about a major struggle ensuing at that level. And back on Mar. 2 he was right about that secondary resistance at $1145:

"The good news about finally overcoming a stubborn level like $1,128 is the breakout is often very strong and linear. But in this case there is another potentially troublesome energy level overhead around $1,145, but after so much testing and probing of $1,128, I’m thinking now that $1,145 will not be so difficult, and should only briefly impede further upside progress."

We are now at $1127, and this trip to the fractal energy barrier looks good for final breakage.

Tuesday, March 30, 2010

The New Oil And Gas Industry

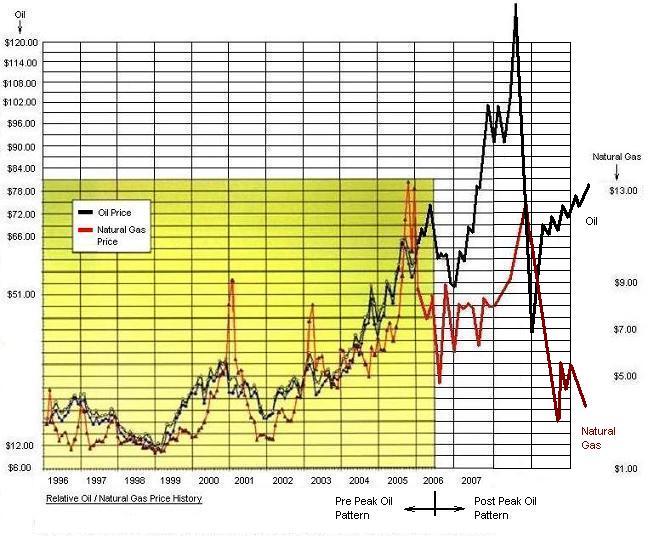
When enterprising companies first started installing wells in the ground to retrieve oil, they had to deal with the natural gas that was part of the oil find. It was combustible and a source of energy, but it was regarded as a nuisance to get out of the way in the oil recovery process. As the decades of the fossil energy age rolled on, natural gas was given much more respect and attention and capital was deployed to capture and pipe it to end users as a clean burning alternative to oil and coal. But it was always considered one business - oil 'n gas. So much so that there evolved a pricing guide among investors to gauge the over or under valuation of the oil or gas price. This guide was simply that under stable conditions, oil should be about 6 times gas. For many decades that has been a pretty good guide, but it no longer applies - since about 2006. So what happened in 2006? Two mega developments - peak oil and hydro-fracing in gas bearing shale.

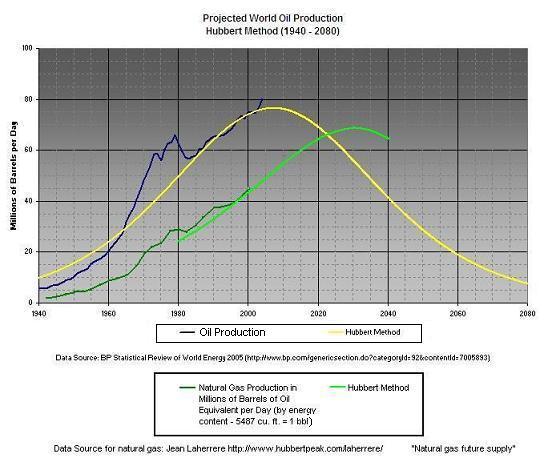
First, oil and gas are peaking at two considerably different time frames globally. (click to enlarge charts)

This was never a big deal in the past because both production curves advanced in unison. But now in 2010 (check the above chart) we are going into the "criss-cross" where oil is fast becoming a lot more dear than the gas. This chart actually understates the case because gas production produces NGL (natural gas liquids) that condense out of the gas processing and are added to the official "oil" supply numbers, about 8 million barrels a day worth of our 85 million barrel a day habit. This fat portion of our oil is actually natural gas production energy. The above chart illustrates why natural gas is often referred to as the "bridge fuel" we need - a bridge of about 25 years between the oil peak and the gas peak to safely get us across to the nonfossil fuels of the future, like sugar and cellulosic ethanol, scaled up to what we need. Oil companies that used to discard gas like a candy wrapper to pump their oil finds are now making moves to develope gas as the main attraction, because they are beginning to realize that natural gas is becoming at least as primary a fuel of the future as crude.

To greatly aggravate this disparity between oil and gas supplied energy, technology breakthroughs in gas drilling are now making it possible to recover vast amounts of gas entrained in shale rock that have always been known to the industry but deemed unrecoverable. North America is blessed with a Saudi-like supply of this stuff, and it is why the above mentioned bridge could be lengthened beyond 25 years and it is why the price of natural gas is about the only thing going down these days:

Inside the golden box, the 6 to 1 pricing guide held pretty well. When the ratio got out of whack, you could pick which one was more typically priced and expect the other one to soon come into line. But now you have to think outside the box, horrible pun intended. The current ratio is over 20, and I don't think it will be near 6 anytime soon.

All this explains why it is so tragic and insane to slight cheap domestic natural gas drilling in favor of expensive and highly toxic and geopolitically suicidal oil imports and greenhouse gas challenged domestic coal. "Clean coal", according to Jim Cramer, is an oxymoron invented by the black lung coalition lobbyists. Making coal anywhere near as clean as nat gas already is will nearly bankrupt the country - just what we need now:


It should be noted that about all the alternatives to natural gas, except sugar ethanol and maybe some future cellulosic forms, suffer from a big net energy problem. It takes about as much energy from oil to make it as it replaces - no solution to a vanishing oil supply.

The current U.S. Congress has a bias against natural gas, but other nations around the world aren't so dumb and run a large portion of their fleets on natural gas. They pay much less per gallon equivalent. Boone Pickens points out that 7 gallons of diesel is the energy equal of one MCF - current price is $3.00 a gallon of diesel times 7, or $21 vs about $5 an MCF of gas. But you have to put up with your engine oil staying clear as the day you put it in and your engine lasting much longer.

Wednesday, March 24, 2010

Gold at Pivotal Point

In its correction since December, gold now sits at a crossroads between bull and bear. As I pointed out in my post on gold a few days back, the fractal analysis has gold nearing the end of a typical 4 month phase (down since December) and at the turn point into a new cycle (up into a fast climb to over $2000 into early 2011. Technically, we see gold perched atop the critical 140 day ema that is one of the best ways of dividing bull and bear markets: (click to enlarge charts)

Here we see gold's RSI entering regular buy zones just below 40 with those points correlating very well with the 140 ema support level. We are smack on one of those right now. We will either dive through it, perhaps linked to a new leg up in the dollar, and go toward the bottom of the correction's megaphone , or we will turn and break the formation with a swift move up. This megaphone breakage would also be a break of a fractal energy level stronghold of $1128 - the shoulder level of the head and shoulder top shown. The odds would seem to favor a hold of the 140 ema, which would also be a completion of the larger scale inverse head and shoulders bottom to the correction. But who knows. Until this situation resolves itself, new positions in gold may be a little dicey. Gold does not have to dance to the tune of the USD, but to the extent that it does, it is linked to a possible turn there too as this article on China over at safehaven discusses.

Tuesday, March 23, 2010

The Shoe Bull

As Jim Cramer alerted us to on Mad Money yesterday, there is a bull market in shoes right now. As usual, he zeroed in on "best in class" which he deems as Nike. I like bull markets but I don't like high profile, so I'll offer two shoe names that Cramer would frown on - Rocky Brands RCKY and Crocs CROX. Well I guess Crocs was high profile awhile back, but Rocky is quite obscure.

RCKY makes a lot of cowboy boots - very expensive ones. That's one thing that you'd think would be getting absolutely killed in this retail environment - completely needless spending by the average Joe. But just look at this chart: (click to enlarge charts)

These people know how to survive, and the stock price is showing the first twitches of emerging from the coma investors have put it in. It was dead as a hammer across the big market event of March '09 - about all the weak hands gone. I remember this one catching my eye back when it was around a comatose $4 over the course of the July market sell-off last year, but I never got around to buying it. The short term technicals currently look good:


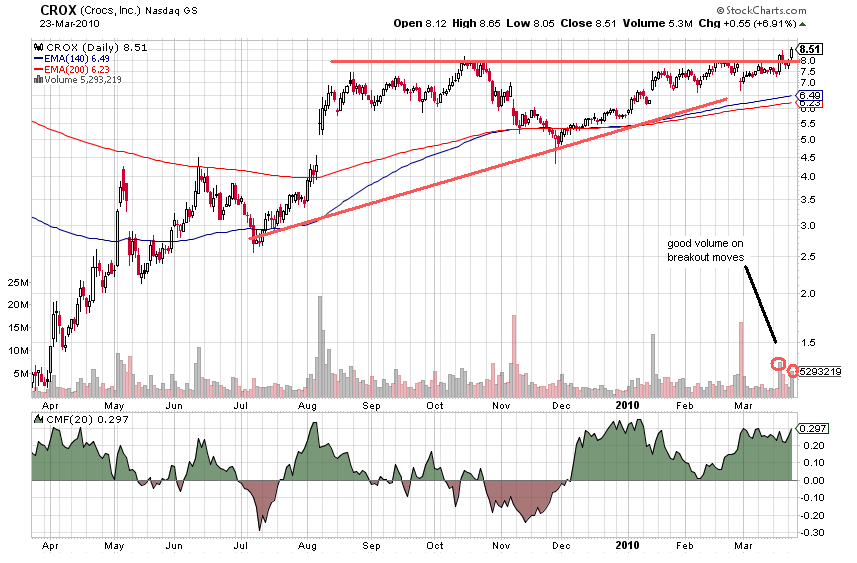
There is a resistance level at $9.5 that will soon break if it follows the lead of CROX and NKE. CROX has been working on a similar formation:

I wrote up a buy case for CROX back on January 16 and it now looks ready to move above $8.