Saturday, November 12, 2011

$1764 Update

Back on September 7, I wrote an article on Jim Sinclair's projections on gold Sinclair's Point Well Taken. He caused quite a stir in gold bug world a month earlier with his August 6 article at his website and an interview with James Turk. This all involved his analysis about the $1764 level in the gold price. As my article explained, back in 2005, Sinclair made a bold prediction about his "angels" or levels of gold's advance where critical resistance is broken. There are several of these, but the one at $524 he viewed as a "swing point" where the rate of gold's climb was to change. This is what happened:


As the moving averages show, he was so right. Gold has been in a steeper climb since the break of the gently rising resistance line shown above in blue. He bases this on the squares method that Jesse Livermore used with stunning success decades ago. Sinclair's father was a business partner of Livermore, who is considered by some the greatest trader of all time.

Anyway, Sinclair is causing a stir because he is now saying the same thing about the $1764 level that he said about $524. When gold shot beyond $600, the common take was that this bubble was about to burst. In his August 6 article, he stated that at the then price of $1650, a top in gold was nowhere in sight. This was before the break to $1930 and the big smackdown that followed. In the August alert, he said:


The key number in the gold market is $1,764. As gold approaches that number you can anticipate furious but very short price reactions ... Dean Harry Schultz said that I should call him when gold trades at $2,400. Stay near your phone my dear friend of more than 45 years, Dean Harry.

So, what has transpired since then?


The date of Sinclair's article is shown by the circle. Gold immediately burst to over $1900 and we began the "furious but short" push backs around this critical swing point - 8 crossings of the $1764 level shown (plus one more since I made this graph). This guy Sinclair is a little freaky. I somehow suspect we're going to get maybe one more knock down to the 140 ema area and maybe a scary break of it before we're through, which would complete a pennant formation forming now. But then again, gold could explode to the noted $2400 level quicker than any of us sensible people think. It's getting into a phase where you may just want to take a seat and hang on.

Tuesday, October 4, 2011

Generals In Danger ?

One of the market tells that one should keep an eye on is the behavior of "the generals". These are those stocks that lead to the upside and are very stubborn about joining any bear market collapses. The old wisdom is that a market decline isn't complete until the generals have been taken out and shot.

Well if you take a look at some of the popular generals now, you might say they are being blindfolded and given their last cigarette. Take, for example, Herbalife. This stock has shown astonishing resistance to all the market turmoil, and is still looking very strong. But there are bad problems developing:


The moving average pair of the 140/200 day ema (blue and red lines above) that I like to watch has been holding as support all the way, but now is being breached. I don't mind a brief puncture of these two moving averages, but when it is in the context of the negative RSI divergence and the negative A/D trends shown, it is a bad sign.

Another popular general has been Core Labs. They help oil and gas companies map out reservoirs for the more complicated recoveries that producers must deal with these days. They've been like the Apple of the energy industry - indispensable. The stock has beem immune to all the market dips - until now:


Here we see the same negative RSI divergence over the last few months and the tell tale negative A/D (accumulation/distribution) switch. This general has already taken a bullet.

Speaking of Apple, could even this general be in danger?


Uh oh - maybe so. The A/D is still looking good, but a negative RSI divergence is clearly happening. I tend to think of Apple not as a high flying tech stock, but a utility or a soap and cereal defensive stock. Their products are used by us all like we use soap, cereal, and electricity. But even the defensive recession generals aren't looking so good these days. Take for example Perrigo, the off brand maker of money saving goods that thrives in bad times. The stock has been off limits to the bears:


But we see the same RSI and A/D melt downs developing even with this one. The high flyers are meeting a similar fate. Green Mountain Coffee is unraveling, not to mention Netflix:


The state of the generals is not good. This is the exact same analysis that caused me to get defensive on the general market back in May when I posted Market Changing Stripes ?
Here is the chart of the S&P 500 I posted in that article:


This RSI and A/D pair accurately forecasted the market's decline thereafter.

We're likely to get a bounce soon from an oversold condition. The behavior of that bounce will be critical to determine if we get back to a choppy sideways market or go into a further decline. If the generals don't break out of their weakening pattern in the bounce, the forecast won't be very good.

Monday, October 3, 2011

Socialism In Bull And Bear Markets

Complaining about our presidents in the US of A is maybe second only to baseball as our national pass-time.   So allow me to indulge in a rant.  I want to take a somewhat spiteful look at the financial market history of our presidents since John Kennedy - an era that I think of as a Comedy of Errors, one of the Bard's great plays.   But it isn't so funny.  Then we will look at our upcoming election in the light of all this.


John Kennedy gave us a free market administration, with low taxes and a business friendly slant.  He felt that the tax and regulation burden on business was an economy killer.  His policies extended the great bull market from the late 1940s to 1966, the post depression recovery.  Perhaps his most famous wisdom was "Ask not what your country can do for you.  Ask what you can do for your country". This saying has a lot of significance in our present heated debate over what our government should be doing for our mess as opposed to removing over-taxing, over-regulation, and other short-term government fixes so that individual businesses can do their thing for our country.  It would have been a good Tea Party slogan had it not already been used by Kennedy.

Unfortunately, Kennedy's VP didn't have his partner's key wisdom very near to his heart.  Lyndon Johnson was probably best known for his Great Society programs, which were an over-done version of some of Kennedy's initiatives to help the poor.  Under Johnson, they became big government helping hands in a War On Poverty, as if it were government's job to regulate the economic status of individuals.  Some of these things survive to this day, like Medicare, and are a big help.  But many were bureaucratic boondoggles - and all began to be a tax problem.  By the time LBJ left office in 1968, the great secular bear market of 1966-1982 had begun.  You can't blame that whole bear market on one president, but an age of asking what your country can do for you had begun.

Then came Nixon.  A normal paper/hard asset cycle turn had begun away from paper investment and to hard assets (commodities).  The turn away from the 20 year stock bull market to the 16 year commodity bull market that began in 1966 was perhaps triggered, or at least abetted, by the bad business policy that came after John Kennedy.  Economy friendly government seems to have died with JFK's murder in 1963.  The commodity bull market had inflation running at around 4% in Nixon's time.   His reaction? - wage and price controls.  Was he a student of the Soviet Union?  This socialist intervention was a dismal failure.  It was a government engineered fix to a government engineered problem.  Sound familiar?  The economy truly went into the ravine under his socialist guidance.  And he took us off the gold standard in 1971 for good measure.  This was to facilitate the government's "helping" hands and loosen up its wrist for the dollar's printing press to follow.  By the time Nixon left office in 1974, the stock market had lost about 50%.  He was bounced out of office for lying before he could do any more damage.

Then came Ford and Carter.  Ford served only briefly and sadly, Carter was a damper on the economy.  His forte was, and is to this day, international peace negotiation.  He put together the Camp David Accords easing Mid-East problems for quite awhile.  But on the economy, he seemed to want to continue the post Kennedy legacy of bigger government, bigger taxes, and more departments (he added two right off the bat) and was the first bail-out president when he bailed out Chrysler in 1979.  Before Obama-care, there was "Carter-care", a government-run health-care system that went nowhere in Congress.  He created the massive Superfund to clean up chemicals in the ground wherever they could be found.  If there was a problem with the economy, government could fix it.

All of this string of socialist presidents, Johnson, Nixon, Ford, and Carter spanned the 15 years of the great secular bear market in stocks from 1966 to 1982, which saw the Dow unable to break 1000 and lose a lot of ground to stagflation. Then came the Reagan Revolution.  And it was just that - a very fundamental change in government, the first real change since Kennedy died.  Whereas LBJ declared war on poverty, Reagan declared war on big government.  Many presidents' worth of government helping hands had the Reagan campaign's "misery index" at such an unbearable high that he was swept into office in one of the most one-sided elections in history.  Reagan declared war on big government and big spending and was the first real business friendly president in 20 years.  And the markets picked up on it, sending us roaring into a secular bull stock market and economic growth.

The next chain of presidencies, when you think about it, was 5 terms covering 3 men and 20 years. They all pretty much sought to continue the Revolution. The Clinton terms in the middle wound up being free market and business friendly, not to mention, with the help of a good economy, budget balancing.  Clinton, either by the mandate of the mid-term elections or by a change of philosophy, or both, put together a pretty fair economic team by the time he left office.

But in the biggest socialism blight ever, we had a banana republic regime of central bankers imposing the greatest mountain of debt of all time on all of us.  All four men occupying the White House from 1981 to 2008 turned a blind eye to this fifth column as "market stuff" that they didn't need to worry about.  A new tyrant had taken over the bull/bear cycle, and the 1982-2000 secular bull was killed not by over-interventionist presidential socialism, but by financial weapons of mass destruction.

With Bush II and Obama, we have gone back to the post-Kennedy and pre-Reagan socialist world. Bush did not exactly have a revolutionary, business friendly congress, and Obama would confiscate every private business in the land if he could get away with it.  A secular bear market in stocks and all non-debt fueled paper assets began in the 2000s.  Robust economic growth now seems to be a thing of the past.  Obama is responding to these problems with the socialism of Nixon, and the government helping hands of LBJ and Carter.

As the over arching socialism of central bankers puts debt and currency issues front and center, the old fashioned president/economy relationship is fading.  The "socialist" Bernie Sanders is the only major US presidential candidate I know of to advocate reinstating Glass-Steagall.  This was the safeguard necessitated by Depression banking collapses that barred banking fools from gambling with depositors accounts in stocks or anything but the business forming loans they had been doing before the Roaring 1920s led them astray. 

We had many decades of banking peace after this 1933 Act.  Then came the banker inspired repeal of Glass-Steagall in the roaring 1999, and we have had one financial crisis after another ever since.  Fully reinstating Glass-Steagall is an issue in the election as detailed in an article at NerdWallet "Glass-Steagall Act: 1933 Law Stirs 2016 Presidential Race". Sanders' reinstatement would take away the $20 + trillion of speculation toys (all our bank accounts) from big banking.  But even this would perhaps be too little too late.  The point to consider is this: the era of the power of the president over our financial cycles has ended.  Getting it back may involve more radical upheaval than a US president can muster.

We would have to have a Reagan Revolution in every major country in the world, but even that would not solve the massive delevering cycle and global debt resolution problems we now must endure.  This problem did not exist in 1982.  So the unruly Trump/Sanders hoards are now a budding revolution not so much against big government, but against the new socialism of big "Wall Street" - the perversion of what free market capitalism used to be.  Main Street is becoming incensed by it, and this election campaign is showing it.


Wednesday, September 7, 2011

Sinclair's Point Well Taken

As I pointed out in my post "Gold Technical Update", before gold got to this $1800 level, Jim Sinclair had been predicting a major "swing point" for the gold bull market when it got to $1764 by his exotic squares math, which I don't really understand. But he tends to get it right, and he was saying that gold would encounter a more intense price action at this level. This was to involve some severe push-back, a pitched battle - one of the biggest in the whole bull climb- before a more powerful up phase takes over.

Well, what has transpired?


His silly prediction, based on nothing but math, seems to be happening as usual. When gold jumped the predictable channel it has been in for 3 years at about $1700, it went right to work on the swing point. It doesn't seem to want to spend much time either above or below $1764 nowadays. And the trading has intensified to a less tranquil pattern. If this is to be one of the big battles, we should expect a few more dips below $1764, more prime buying points for new positions.

Tuesday, August 23, 2011

The Crisis In Leadership

No, I'm not referring to the clowns on vacation from our congress. We have an astonishing lack of leadership when they're in town, too. I guess they're all tuckered out. Screwing up the world like they have done is hard work.

My title refers to the market leadership. The leader groups that have been signalling the future direction of the market for the last 3 years, the retailers (RLX), technology (QQQ), the consumer discretionary stocks (XLY), and the transports (TRANQ) have a conflict going right now. One says new bear market. Two say bull correction. And one is undecided. They've typically been in agreement up until now. Let's look first at the one screaming new bear:


This would be the Dow Theory important transports. They have broken down from any semblance of a continuing bull and are leading the charge down. The same can be said of the important financials. It's hard to have a bull market without the financials participating. Doug Kass, who called the March '09 bottom to a tee, is now saying the banks have bottomed. Jim Cramer says the group is still toxic.

If you look at the retailers, supposedly the sore point of the recovery, you see this:


A trend line from the March '09 bottom appears to be intact. But if you look at all the consumer discretionary stocks, you see a breakdown more like the transports:


The accumulation trend is beginning to break but holding, but the price action has already broken. As for technology:


This looks just like the retailers - a brief puncture of the 140/200 day ema moving average pair but on a bull trend support line.

This sets up a battle between these stock groups. Either the groups that are barely clinging to bull mode will be pulled down into what the transports are doing or the transports will be pulled back up into confirmation. Stay tuned.

Sunday, August 21, 2011

Silver Technical Update

If you hate to chase anything at an all time high, and don't we all, then you don't really like buying much gold right now. But maybe we can cheat and buy gold's rocket ride via silver. This bifurcated metal constantly has to decide whether to follow its industrial use self and follow the stock market or to follow its monetary metal self and follow gold. The monetary self usually wins out over the long haul as is evidenced by the R squared for gold/silver being around 0.95 long term. So any straying of silver behind gold is a good buy-the-massacre move. Buy-the-massacre is so much better than chasing.

The massacre in silver has it nearly 20% down from its high now, right at the 20% decline bear market classification. But it will very likely slingshot to par with gold. This is after all a monetary crisis we are in.

The silver/gold ratio chart looks like this now: (click on charts to enlarge)


Silver is just now emerging from an RSI turn point where it begins outclimbing gold. Even if it stays bound in the horizontal channel it's in, it will match the climb in gold for awhile. You can't complain about that.

The price chart looks like this:


The consolidation of last year looks to be repeating and is probably ending now. The channel appears to be thoroughly broken. If we get a post consolidation climb like last time, we are at a prime buy point.

Wednesday, August 10, 2011

Gold Technical Update

Gold may be breaking into the next phase of its bull market. Jim Sinclair's math has a long history of correctly predicting gold, not just in this bull market but in the 1970s bull market. He is now saying that the $1764 level is a swing point into a steeper climb similar to $524 was in late 2005.


Then, as now, gold was faithfully obeying the 140/200 ema moving average pair (red and blue lines) as support and the trend line shown as resistance. Then a break of this resistance occurred with a move to $524, a test of old resistance as support, and a huge new move into the next bull phase. As a weird coincidence from an entirely independent means of analysis, David Nichols' monthly fractal forecast is currently putting gold into a 64 day growth cycle into early October that he says will be the strongest yet in the entire bull market. That's 64 trading days (closer to 3 months calender). For those of us who simply like to study lines of support and resistance, it is also obvious that a change has occurred:


This chart is very similar to the 2005 chart above with the $524 swing point, but with the new $1764 swing point. It shows a pretty stable 3 year phase of gold's bull where a persistent line of resistance turns all the rallies into declines. There was a brief breach at the end of the strong 2009 four month cyclical move. The current breach is occurring at the beginning of this typical August to November strong period. This all implies a big bust of the 3 year channel.

I have outlined my disagreements with David Nichols' fractal analysis in other articles. My only problem back in 2010 was with his 64 month fractal or about a 5 year time limit on the high growth part of the overall bull market for gold, which he reckoned was to turn to bear market in February, 2011. I argued that this parabolic bull fractal pattern had other variations longer in duration that would go well beyond February, 2011, and that the current gold bull seemed to be an example of these. Well, February has come and gone, and I think it's safe to say there was no arrival of a bear market. But I can find little fault with Nichols' month-to-month range fractals - they have been stunningly accurate over the years. Jim Sinclair's call about $1764, David Nichols' call for the strongest 3 month move up yet, and the above simple support/resistance map all agree - gold is entering a new phase, and it ain't a bear market.

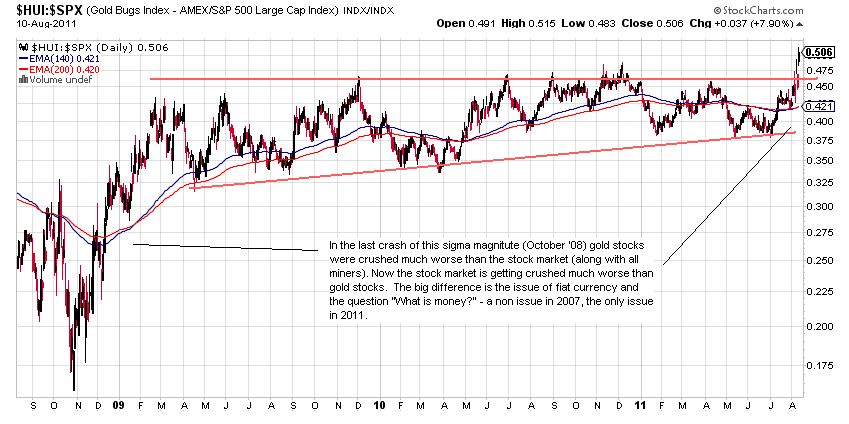
The cold calculating methods above also agree with a phase change in psychology that I believe has occurred over the last 3 years. This involves the basic question "What is money?" Well, it's that green and gray stuff passed around or it's electronic equivalent you may say. But is it? Is it really? That's what we used to think back in 2007. Is that what they're thinking over in Europe today? You can see this sea change in a 3 year chart covering the last two mega market crashes:


Here we have the gold stock index / S&P 500 ratio charted from mid 2008 to now. It drops when the gold stocks are under-performing the broad market and vice versa. As you can see, there is a vast difference between then and now. Why? There is a fundamental change in view going on as to what is money.

I have posted a discussion of this rapidly changing view with some interesting testimony by Ben Bernanke last month before Congress over at seekingalpha.com - just put my name in their search bar. The post is "Gold's New Phase And The Coming Revolution". It should be up in a day or two if it's not there yet.