Friday, November 27, 2009

Debt Dominoes, Here We Go ?

The Dubai debt scare focuses our attention to the one big thing that differentiates this recession, stimulus, and resultant rally from the previous cycles - the inordinate mountain of global debt. Despite the U.S. housing bust beginning clear back in 2006, you still have debt writers putting up indoor ski resorts in the middle of the desert. And Dubai isn't the only one still being this silly.
The domino effect, in my opinion, deserves more respect than most pundits and the market is giving it. Despite this view, however, I've been a bull on the market since late March. Back then, I wrote this view in a comment on a Seeking Alpha article by Bespoke Investment Group. The article pointed out a near term overbought condition predicated on the S&P being near a standard deviation above its 50 dma. This tends to occur as a single dot on a chart signaling the top of a bear bounce or as the start of a cluster of dots signaling the start of a big climb (click on link below to see article). My opinion was that it was signaling the start of a big climb, but note the caveat at the end of my comment:


S&P 500 Near Overbought Levels [View article]
It looks like it will be more a case of the multi-month climb like we saw into May '08 (the congested red dots in the middle of the graph). The conflicting technicals of the dangerous, uninvestable gyrations within the downtrend seem to be resolving into a buy signal (the kind VectorVest issued on 4/3/08 until their sell signal issued 6/11/08). If you look at the leading indexes (transports, financials, retailers) they are all just now breaking key resistance areas that would differentiate this rally from the other spastic bear market moves. The RLX retail index has now broken through the well entrenched horizontal line of resistance at 300, The transports and financials are now breaking the down sloping trendline through the highs. These leaders are following the technical steps of China's Shanghai index, which is now trading above a climbing 50 dma after a 50/200 cross (several steps ahead of the SPX).

The real test of these precarious spikes out of decline mode will come next week with the market's reaction to the wretched earnings and guidance that will replace all the nice rally talk. If the market has only mild or no reactions, then it won't be just another two week flying knife bear bounce anymore.

I've been expecting a good climb through the middle of the year '09, although I thought there would be a very sharp panic stricken VIX 80 dive to preceed it, which didn't happen. Major moves down such as we've had since '08 usually end that way. I'll take any kind of good move up I can get; but I suspect that toward the end of the year, it'll be ugly again. There are too many debt dominoes yet to fall.
Apr 03 20:26 pm |Rating: +2 0 |


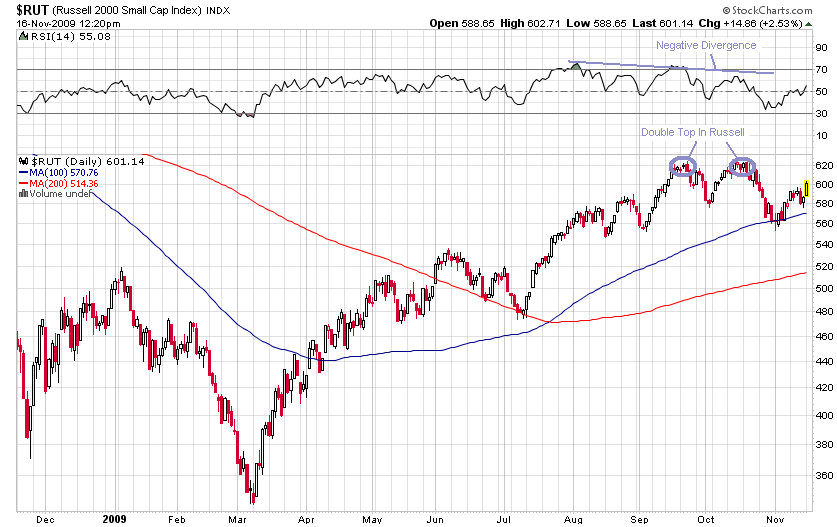
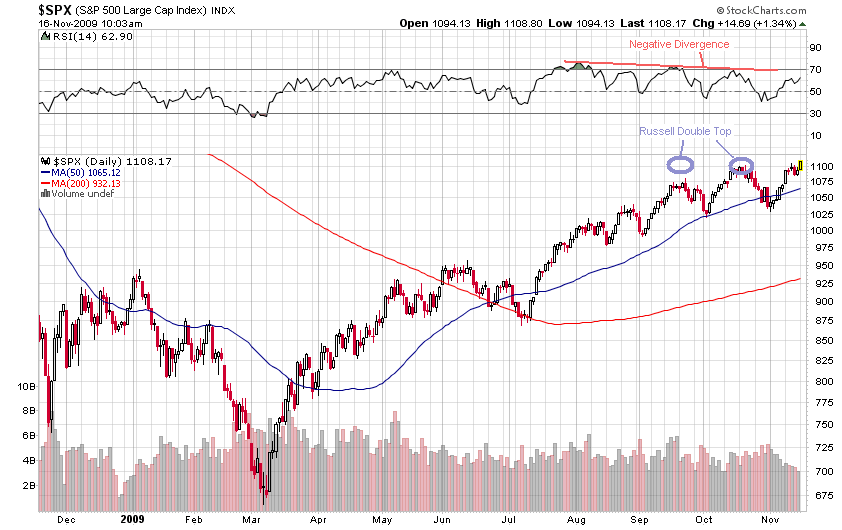
We certainly have had the good climb since April 3 when I wrote that. I hope I'm wrong about the debt domino ugliness at year end, but it's hard to stop a domino field from proceding once the first one has been tipped. I've backed off to neutral on the market mainly because of how the small caps are behaving vs the big caps (see my Nov. 16 post) but Iran and now Dubai are problems as well. The leader groups that have faithfully called the market's direction all year (RLX, BDI) would have maybe a couple month's of mild consolidation and then more upside. But those dang dominoes! When a fool's ski resort in a desert in Dubai can hammer down your shoe maker's stock headquartered in Des Moines - well, that's dominoes for you.

Wednesday, November 18, 2009

Ag Boom Is Igniting

When anyone asks Jim Rogers for his best advice nowadays, he says "become a farmer". He is busy buying up farming operations all over the globe. It is the farmer, he says, that will be driving the Maseratis of the future, not the growers of creative debt instruments on Wall Street.

It is part of a seismic shift in valuing real assets over paper as is the case with commodities in general. But with food, there is much more too it than that. There is a food shortage developing that may wind up being more severe than say oil supply. A rapidly upgrading and very large BRIC population is placing a strain on global food production. They estimate total food production will have to rise by 70% over the next 40 years. That means $44 billion/year will have to be spent on Agriculture to produce that growth rate vs only $7.9 billion/year now.

This food shortage problem began to show itself in 2007 running crop prices and fertilizer stocks to the moon - and then back to earth with the whacking of the Great Recession. These investments have pretty much remained whacked this year, lagging about everything else, but they are reigniting. They have the potential to be some of the more explosive climbers available very soon, especially considering the historic droughts afflicting the chief food growing regions of the world right now. It is looking like global food production could be down 20% or more because of this pinch.

The food shortage is compounded with the currency debasement problems around the world. Nations will probably want to exchange devaluing paper bills more urgently for edible hard assets than for inedible ones.

Food crop shortage is also compounded with the oil shortage because fuel crops such as sugar (60% of the world's ethanol) compete with meal crops. Inflation adjusted, crops have severely lagged other commodities as this historical chart shows: (click to enlarge)

Using the heights achieved during the previous commodity bull market as an inflation adjusted reference, you can see that crops have of lot catching up to do. Be a farmer!

Monday, November 16, 2009

Talking Phase May Be Over With Iran

As discussed in some of my previous posts on Iran here at my blog, the diplomatic talking efforts to resolve the nuclear facilities issue with Iran seem to have come to an end. DEBKAfile has just published a report this evening on top U.S. and Israeli intelligence and defense officers meeting in Israel. They said:

Our intelligence sources report that frequent Middle East visits by high-ranking American intelligence teams are rare occurrences. Worthy of note is they are immersed in a second round of talks with their Israeli colleagues in the first half of November, in between two other related events: the joint US-Israel Juniper Cobra 10 ballistic defense exercise which ended last Tuesday and the publication of the much-awaited UN nuclear watchdog's next report due out Monday, Nov. 16. This report should lay out the findings of the IAEA inspectors at Iran's uranium enrichment plant near Qom

Those findings reportedly will say that the plant was designed "especially" for nuclear weapon enrichment levels and was a military installation.

sources say that the US-Israel intelligence conferences ongoing at present are the final touches to the process the Obama administration has instituted of strategic give-and-take with Israel ahead of a possible outbreak of war with Iran. The alignment has been going forward on four levels:

1. Communications between the White House and the Israeli prime minister's office, which are handled at the Washington end by Dep. National Security Adviser Tom Donilon, who enjoys ready access to the president.

2. An open line to defense secretary Robert Gates which defense minister Ehud Barak set up when he visited the Pentagon last week.

3. Direct interchanges between the two army chiefs, Chairman of the Joint Chiefs of Staff Adm. Mike Mullen and IDF Chief of Staff Lt. Gen. Gaby Ashkenazi.

4. Frequent conferences between US and Israeli intelligence heads.

Political, military and intelligence integration between the US and Israel on this comprehensive scale has been practically unknown in recent years. It serves the dual purpose of a demonstration of close American-Israel military cooperation while at the same time safeguarding the Obama administration against Israeli surprise moves in relation to Iran.

Sunday, Nov. 15, President Obama and Russian president Dmitry Medvedev said in Singapore that time was running out for diplomacy to resolve the crisis over Iran's nuclear program. Medvedev added that if discussions failed to yield results, "other means" could be used.

Tehran delivered its comeback the same day: Iranian president Mahmoud Ahmadinejad declared grandiloquently: "Iran is a great world power whose strength is unlimited and on whom no other state would dare impose sanctions," while parliament speaker Ali Larijani blasted America whom he accused of backing the Saudi bombardments killing Muslims (Shiites in Yemen). Obama is worse than George Bush, said Larijani: "His promise to change US policy toward Tehran amounts to nothing." He flatly rejected the latest Western proposal to resolve questions about Iran's nuclear program (overseas processing of enriched uranium) as "unimportant" and "irrational".

Sounds like the Iranians are through talking too. In another DEBKA piece, they say "the Iranians are frenziedly digging hundreds of new missile launch silos" to prepare for Israel. Of the two intelligence sources, DEBKAfile and STRATFOR, I trust STRATFOR more. But this agrees with what STRATFOR said in that they believe Joe Biden's policy speeches in Europe about 3 weeks ago signalled "A Change In American Plans On Iran" as I posted about here on November 9. STRATFOR believes "...this means the United States must choose between an Iranian bomb or employing the military option."

The Russell 2000 - A Nagging Problem For The Rally

Besides the Nasdaq Transportation Index (TRANQ) woefully short of confirming the broad market's nice climb on the year, the rally has the recent action of the Russell 2000 as a fly in the ointment. These two indexes are important. The TRANQ is the transports with almost no rails, which is what you want to look at for Dow Theory confirmation of developments in the broad market. The rails have become very levered to commodities, and thus to currency debasement and the China story. So they really tend to distort domestic economic health in a way Charles Dow did not intend. If you look at the difference this makes in the transport indexes, you see it is significant. The Russell 2000 is important because it is more broad based, having 2000 stocks instead of just 500 or 30. And perhaps more significant, it is made up of small caps, which tend to make major turns ahead of the larger cap stocks. In fact, if you had just been watching the action of the Russell as your only canary in the coal mine, you would have been tipped off as to just when to get out in 2000 and in 2007.

Let's look at what the charts telegraphed back then: (click to enlarge charts)

Here the Russell refused to return to the early March high as did the rest of the market:

And in 2007, the Russell put in an early top, a double top this time:

This was well ahead of the S&P 500 topping action:

What is the Russell doing now?

So the canary has keeled over again. This would lead one to be very suspicious of the new high being put in place by the other indexes:

We again have the negative RSI divergence not to mention a sharp weakening of the volume on this latest run by the S&P 500.

However, the canary could turn out to be a false prophet of doom this time, predicting only a mild downtrend or consolidation if we continue to faithfully follow the key leader groups as has been the case all year - despite the technicals. The RLX large cap retail index is still very healthy as is the QQQQ large cap technology index - albeit this could now be just by virtue of them being large cap. The Baltic Dry Index has been tracing out the moves of the S&P about 3 months in advance this year, and it foreshadows about 4 months of a mild retracing, then back up again. So how much of a major turn the Russell is telegraphing now, if any, may be trumped by the market's dogged determination to follow these key leader groups. If all the leader groups, including the BDI, start to keel over, it may be time to get very defensive. If, for example, the BDI, now near a previous 52 week high, were to start to form a double top, that would be bad.

Friday, November 13, 2009

Aurizon Mines - A Value Investor's Gold Stock

If you like to have good monetary valuation backing up all your stock selections, you have a tough time buying gold stocks. They dance to a different tune. I like to buy stocks in the context of their historical valuations, but with any mining stock, the pricing is determined as much by what they have in the ground (not producing any cash flow yet) as by about any other measure. That and how much they are spending to find and extract their product is about all the market cares about. You can go with just the mature, big cap producers to seek good value. But you typically run into cases like Agnico-Eagle Mines (AEM). This has been a favorite gold miner of Jim Cramer, the ultimate fundamentalist, but have you looked at its valuation lately? It sports a price/cash flow of 149, a PE of 157 and - well I could go on. Suffice it to say its valuation stinks. But it will climb along with the price of gold anyway - much to the annoyance of all us value investors.

If you want a token value stock in your gold line up, take a look at Aurizon Mines (AZK) from Canada. They have no geopolitical issues having all their operations in North America. The price/revenue is a palatable 4.6 and the price/cash flow is a nice 10.7 and, if you like historical value, it has this history: (click to enlarge)

The price seems pretty well correlated with their financial results over the years and leaves a huge catch up move to be had even if gold were to hang around $800-$1000. The PE has shrunk to a reasonable level (for a gold stock). The stock price has been relatively stagnant this year. As the volume chart shows, investor interest has increased since '06 - everything has raced ahead of the stock price since '06. If the gold price goes into a big climb from here, this stock could have a nice move coming.

Monday, November 9, 2009

A Change In American Plans On Iran?

As a post script to my Nov. 5 post on the web bot Oct. 26 tipping point date, there is another interesting development that fits with a turn around this date from peace to war with Iran. STRATFOR, the "shadow CIA" as Barron's calls it, published some intelligence on this exact date, Oct. 26, discussing vice-president Joe Biden's trip the previous week to several European countries. Biden made a critical departure from the cooperative moves with Russia being done up till now. The Obama administration had been going about revamping the missile defense shield in Europe in an attempt to gain Russia's help in trading sanctions on Iran, especially the ban on imported gasoline. Russia would have to be the major helper there. STRATFOR thinks the bombastic, unfriendly tone toward Russia in Biden's speeches tips off a change in the U.S. plans about negotiation with Iran versus the other options. It was a carefully vetted speech, not Biden's personal musings. In their words:

The American decision to threaten Russia might simply have been a last-ditch attempt to force Tehran's hand now that conciliation seems to have failed. It isn't likely to work, because for the time being Russia has the upper hand in the former Soviet Union, and the Americans and their allies -- motivated as they may be -- do not have the best cards to play.

The other explanation might be that the White House wanted to let Iran know that the Americans don't need Russia to deal with Iran. The threats to Russia might infuriate it, but the Kremlin is unlikely to feel much in the form of clear and present dangers. On the other hand, blasting the Russians the way Biden did might force the Iranians to reconsider their hand. After all, if the Americans are no longer thinking of the Russians as part of the solution, this indicates that the Americans are about to give up on diplomacy and sanctions. And that means the United States must choose between accepting an Iranian bomb or employing the military option.

So if the military option comes about, October 25, 26 may wind up being the turn point into that per the web bot's computations.

Sunday, November 8, 2009

Oil vs Gold Shock Absorbers

Personally, I like air shocks the best, but we're not talking about pickup trucks here. Every long-term portfolio needs to have good shock absorbers. Shocks can come out of the blue and are difficult to develop hedges for. But some shocks are foreseeable, you just don't know the timing for them. Such an item is the current situation in the Middle East. As I have been noting in my posts, we're going through a danger period with Israel and Iran the next 2 months or so where there is a greatly higher chance of an Israeli strike. The further we go into 2010 with no strike, the more likely a deterrence strategy is going to be implemented.

Doing a pre-emptive bombing on Iran's nuclear plants poses many serious problems for Israel. Radioactivity from the aftermath could drift over the densely populated areas next to Iran and kill millions causing severe geopolitical and public relations problems for the Israelis for many years into the future. Recent polls, even in Israel, reveal that a majority think that even if Iran gets nuclear weapons, they won't use them. A strike would likely snuff out the fledgling global recovery we have worked so hard to get going making Israel public enemy #1, even though polls show most Americans would back an Israeli strike. That opinion could change as the complications of a strike wore on. On the other hand, if Israel were to allow Iran to build some nuclear weapons, they could simply wait for their first attempt to use them and respond, probably with some whole-hearted U.S. help, and pulverize Iran into oblivion with all the world cheering them on and designating not only Iran, but all of Israel's enemies as public enemy #1. But there is no telling how many cities and lives they may have to give up in the process.

I think pre-emption is the more likely of the two, but how do you design an investment portfolio until we know how this all plays out? All cash isn't a bad option, but for, say a mutual fund where you need to maintain an exposure to the markets, you need shock absorbers. Although the touchy situation with Iran has been well know by the markets for years, they have become a little desensitized to it with repeated cries of wolf. You hear or read little about it on CNBC or the other financial media, even though it perhaps is the most powerful market moving thing that should be being analyzed right now.

To take a stab at such analysis, let's take the 9/11 attacks as our sample shock inducer. These attacks had a lot shock value. It was the first time in history the U.S. suffered a military attack on its soil. The stock market had to be closed down for days. The next Sunday, churches were filled. We didn't know precisely what countries were to blame, but we knew there was gonna be trouble in the Middle East. The two big things that come to mind to guard against such shocks are oil and gold, in that order. So load the boat with oil stocks? No. Why? Look at the reaction: (click to enlarge)


Oil stocks tend to follow strong market moves too much, even though the oil price did go through a spike (that quickly normalized). It was a much different reaction with the gold stocks:


Gold and gold stocks reacted strongly in the opposite direction. Both these reactions were short lived before gold and oil returned to the bull, bear, or sideways markets they were doing before the attacks. We can thank our lucky stars if market reactions to an Iran strike are so brief.

Friday, November 6, 2009

Dueling Parabolas

The fractal long range forecast for gold is basically a parabola. A long while back, before gold was anywhere near $1000, David Nichols of the Fractal Gold Report drew this result of his fractal analysis for gold's future: (click to enlarge)


I have added the note about the resistance level we have just now broken smack dab centered on the parabola drawn when gold was at $734.50 an oz. This analysis is from pure geometry and physics, which know nothing of idiots in Washington or fools on Wall Street. But they have their parabola too!

I suppose a lot of the debt increase of the 80s can be blamed on Reagan's cold war deficits. But we won the cold war, and in peace-time, debt could have come back to sensible levels. Instead, a new war developed. We were invaded by an army of wiz kids on Wall Street creating and slicing and dicing mortgage debt, and peddling and juggling it to no end. They started their parabola in the early 90s. Gold started its parabola 10 years later in retaliation. Gee, I wonder if the two parabolas could be related?

Thursday, November 5, 2009

Is Web Bot for October 25 a Hit or a Miss?

The October 25 "tipping point" date of the web bots (see my post here Web Bot Weirdness) has come and gone and no real obvious tipping - yet. So is this going to go down as one of their misses? Well, I wouldn't be so hasty to give it a final grade just yet. When they first started picking up strong vibes on this in the internet linguistics in spring of this year, they were about equally divided on whether it would be an Israel/Iran war or trouble with the dollar, not that these two issues would be unrelated. Lately, they have been leaning more toward banking/dollar as what is being tipped into trouble.

There has been some tipping on both issues as the dollar has been weakening and becoming a real concern as a holding by many nations. But perhaps a more dramatic tipping has transpired on the Iran issue. October 25 could be seen as a turn point from peace to war. It was on this date that the inspection of Iran's new nuclear facility took place, and it seems to be more a military facility than a peaceful one. And October 23 was the Friday deadline Iran was to give their answer at the Vienna talks on handing over their uranium stockpile for peaceful processing in France and Russia. Iran has essentially said "no" to a peaceful resolution, giving a late answer the next week that would allow them to hand over their LEU in stages so they could continue working on their bombs. This is a nonstarter at Vienna. It could be that we are tipping into war, which would make for more trouble with the markets and the dollar. From George Noory's radio show Coast To Coast on July 21 summarizing Clif High's work:
- When Israel bombs Iran (also around end Oct early Nov), they will use a nuclear-tipped bunker buster that will hit something unforeseen underground. As a result, a radioactive cloud will form that will pollute and sicken Southeast Asia. This will cause much of the world to turn against Israel.

- The “Death of the Dollar” will be a continuing trend, with a hyper inflationary period in 2010, and banking crises/confidence losses that will begin in August 2009 and escalate by November 2009.

Since the big "no" answer from Iran at the talks, the quiet on the subject has become deafening. Makes me worry.

Wednesday, November 4, 2009

Gold Fractal Update

A lot of predictions are being thrown out these days as gold surges and garners attention going above the $1000 mark. It seems like about half (well maybe 1/3) say it has run too much - short it. The rest are timidly stepping onto the train. It can be confusing listening to the arguments for and against gold because most of them make good sense. Shorters say gold is getting crowded. Longs say it's not too crowded. Have you seen any popular magazines lately with gold and silver cover stories?

There is a totally dispassionate way of analyzing gold that doesn't try to figure what bank may be selling or what government may want to buy or what the human psyche is on moving money into it. There is pure technical analysis that does all of that of course, but then there is the new dispassionate way - fractal analysis.

David Nichols is a pioneer in this developing science and has been incredibly accurate in calling the movement of gold. For an overview of fractal analysis, read the July 5 post here at my blog Is Gold at a Fractal Moment? where I summarize his call that early July would see a major turn begin out of the consolidation since March '08 and into the next hypergrowth phase. Look at a chart and see if that isn't exactly when the present run began.

There are many things Nichols uses to form a projection, one of them being the fractal dimension. This is a measure of energy level. Fractal theory says that anything fractal moves in repeating patterns with an ebb and flow of energy. An energy dimension can be computed that shows where a move is. The current (as of Oct 28) fractal dimension of gold is:

Here we see the big picture (monthly chart) for gold's fractal dimensioning including the 1 1/2 year consolidation since last March, whose end was called to the week. The 30 and 55 levels for the fractal dimension are important because they indicate when a significant move begins full of energy (55) and when a move is nearing exhaustion (30). The big move up in late '05 through May '06 began with around a 58 as did the big climb starting late in '07. As you can see, our current climb starts at 63 and is only beginning on a monthly basis.